


Solana price has erased much of June’s decline by reclaiming the $80 level, with record transaction activity and a technical breakout driving fresh optimism.
Summary
- Solana price has reclaimed the $80 level after record network activity and governance upgrades boosted buying momentum.
- Technical indicators favor further gains, with the next major resistance and liquidation cluster sitting near $90.
- Analysts remain divided as bullish momentum strengthens, while some traders warn the rally still faces key resistance.
According to crypto.news data, Solana (SOL) price traded around $81.3 at the time of writing, up nearly 10% over the past 24 hours after breaking above the psychological $80 barrier for the first time in weeks. The recovery followed a series of network milestones that revived investor sentiment, while the broader crypto market also benefited from improving risk appetite after June’s steep correction.
Fresh on-chain data added fundamental support to the rally. Solana recently activated its Governance Proposal (SGP) framework, allowing validators and delegators to vote directly on network decisions. At the same time, the blockchain recorded an all-time monthly high of 3.77 billion non-vote transactions over the past 30 days.
Network activity also continued to dominate tokenized equities, with Solana processing more than $3.31 billion in decentralized stock trading and capturing roughly 95.6% of the sector’s volume. The network has now led all Layer-1 blockchains in decentralized application revenue for nine consecutive quarters.
Speculative demand has also remained elevated around Solana’s expanding ecosystem. Meme coin launchpads continue generating substantial protocol fees, while anticipation surrounding the Alpenglow consensus upgrade has encouraged traders to accumulate ahead of the expected third-quarter mainnet rollout. The upgrade is designed to reduce transaction finality to around 100 milliseconds, one of the fastest settlement targets among major public blockchains.
Technical breakout opens path toward the $89–$90 resistance zone
The daily chart shows Solana rebounding strongly after finding support near the 78.6% Fibonacci retracement around $68.4, where buyers defended the June selloff and formed a double-bottom structure. The latest advance has broken above a descending trendline that capped prices throughout the second half of June while also reclaiming the 61.8% Fibonacci level near $74.8.
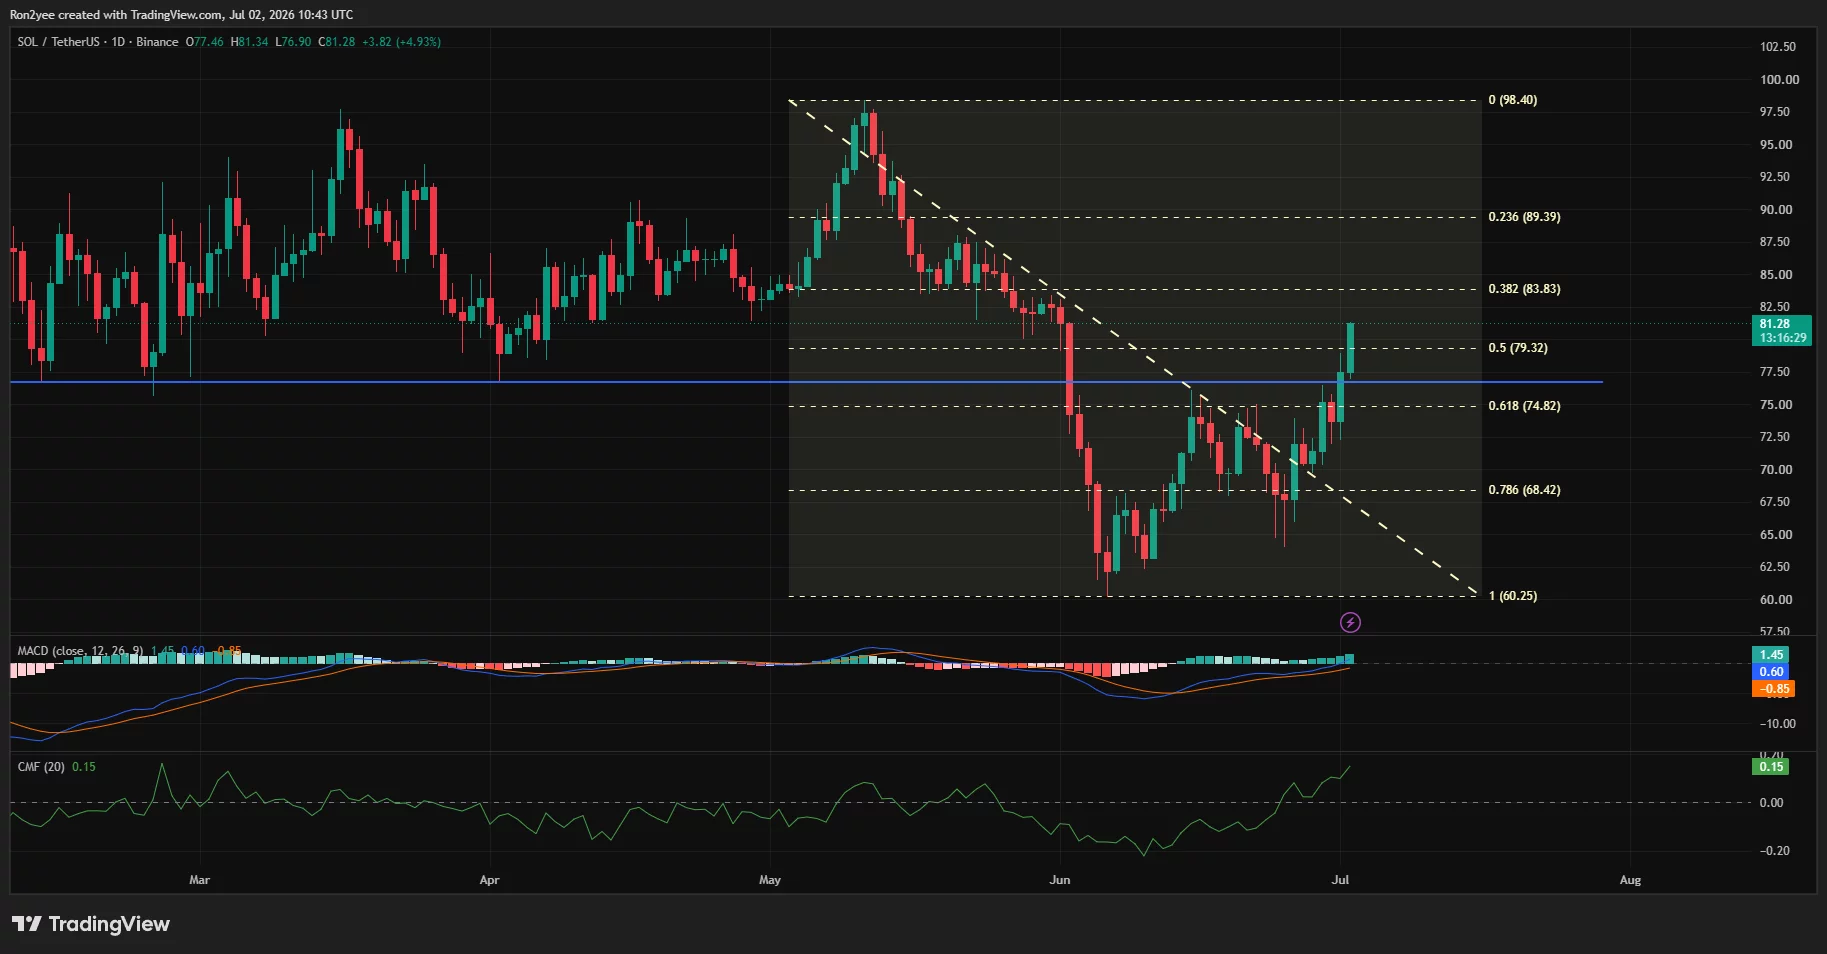
Momentum indicators have strengthened alongside the breakout. The MACD has completed a bullish crossover with expanding positive histogram bars, while the Chaikin Money Flow has climbed above zero to 0.15, showing capital has returned to the asset after weeks of distribution.
The next technical hurdle sits near the 50% Fibonacci retracement around $79.3, which has already been reclaimed, leaving the 38.2% retracement near $83.8 and the 23.6% level around $89.4 as the next upside objectives before the late-May high near $98.
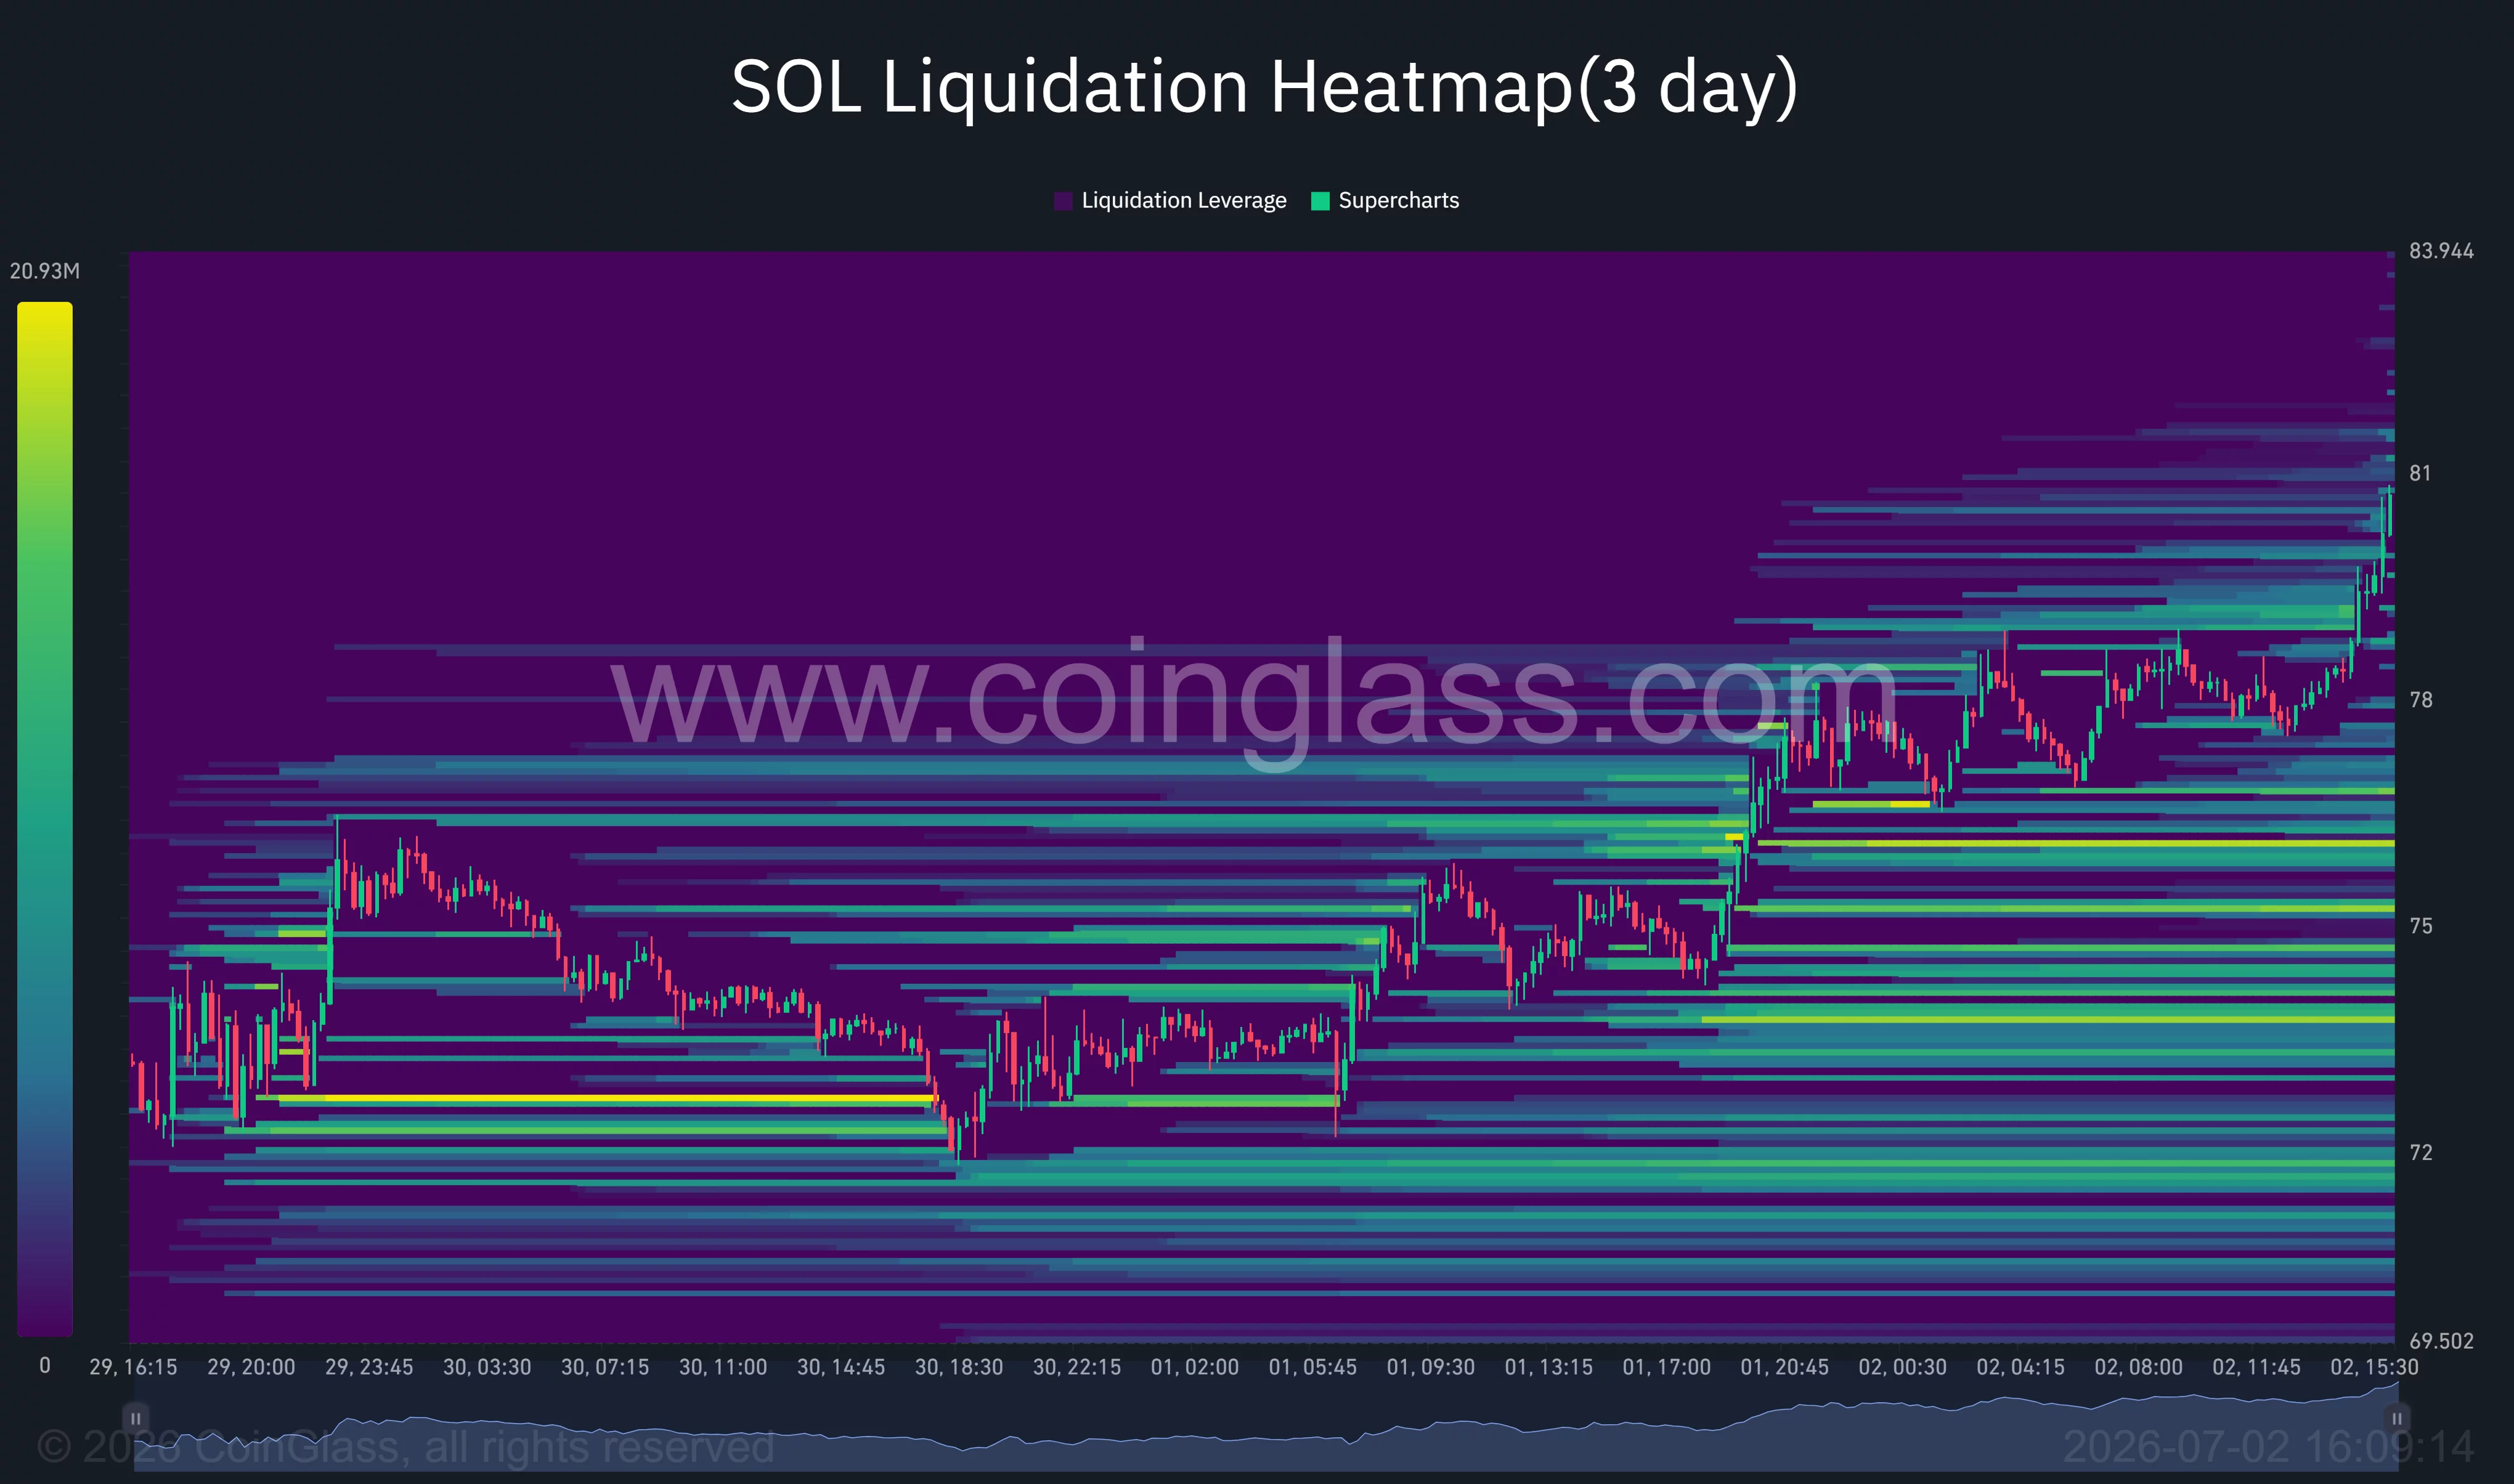
Derivatives positioning also supports higher volatility. CoinGlass liquidation heatmaps show a dense concentration of leveraged short positions clustered between $82 and $84, with another significant liquidity pocket extending toward $89. A continued push higher could trigger additional short liquidations, accelerating any move toward the $90 region.
Commenting on the market structure, analyst Michaël van de Poppe wrote, “SOL is in an uptrend against BTC… buy the dip territory on this one,” adding that he expects the trend to continue into August and September after Solana broke above key daily moving-average resistance against Bitcoin.
Failure to hold above $80 could revive bearish pressure
Not every analyst expects the recovery to continue uninterrupted. According to crypto analyst BATMAN, Solana is once again testing a major resistance area that has rejected price several times this year. He warned that a bearish divergence on the stochastic oscillator raises the possibility of another rejection if buyers fail to sustain momentum.
Macro conditions also remain a risk. Elevated U.S. interest rates continue to compete with speculative assets for institutional capital, while digital asset investment products have experienced intermittent ETF outflows in recent weeks. Any renewed deterioration in global risk appetite or delays to U.S. crypto legislation could reduce buying interest.
From a technical perspective, losing the reclaimed $79-$80 area would weaken the current breakout and expose support near $74.8, followed by the June demand zone around $68.4. Holding above those levels keeps the recovery structure intact, while a decisive break above $83.8 could open the way for an advance toward the $89-$90 resistance band.
Disclosure: This article does not represent investment advice. The content and materials featured on this page are for educational purposes only.