


PUMP price is tightening below a descending trendline as a new cashback model reshapes trader incentives.
Summary
- PUMP is compressing beneath a descending trendline after a recent recovery.
- Pump.fun’s new Cashback Coins shift fee rewards from creators to traders.
- A decisive breakout could trigger expansion, while rejection keeps downside risk in play.
Pump.fun’s native token PUMP was trading at $0.002162 at press time, down 3.2% in the past 24 hours. Over the last seven days, it has moved between $0.001843 and $0.002355, placing the current price close to the upper end of that range.
The token is up 13% on the week, but still down around 15% over the past month. Trading activity has accelerated. Spot volume reached $110 million in the last 24 hours, a 56% increase from the previous day.
Derivatives show a similar pickup in activity. According to CoinGlass data, futures volume climbed 38% to $234 million, while open interest rose 1.08% to $174 million.
Rising volume alongside a slight increase in open interest suggests that new positions are being opened, though leverage growth remains limited.
Cashback Coins introduce new incentive model
The recent compression in price comes as Pump.fun (PUMP) rolls out a structural change to its launch model.
On Feb. 17, the platform announced Cashback Coins, a feature that lets creators choose between traditional Creator Fees or redirecting those fees entirely to traders and holders. The decision must be made before launch, and once a token goes live, it cannot be changed.
Under the Cashback model, market participants, not the deployer, receive all creator fees. The goal is to address criticism that some token deployers collect fees without contributing long-term value.
This change could have an impact on short-term trading behavior. Rewards are tied to trading activity as opposed to passive holding. If volume increases, more fees are generated and redistributed.
That structure may encourage higher turnover and short bursts of speculation. At the same time, it can amplify volatility if traders rotate quickly in and out of positions to maximize rewards.
PUMP price technical analysis
On the daily chart, PUMP is trading below a clear descending trendline drawn from a prior swing high. The pattern shows lower highs, while lows have begun to stabilize near $0.0021. Price is compressing between $0.0021 support and $0.0023 resistance.
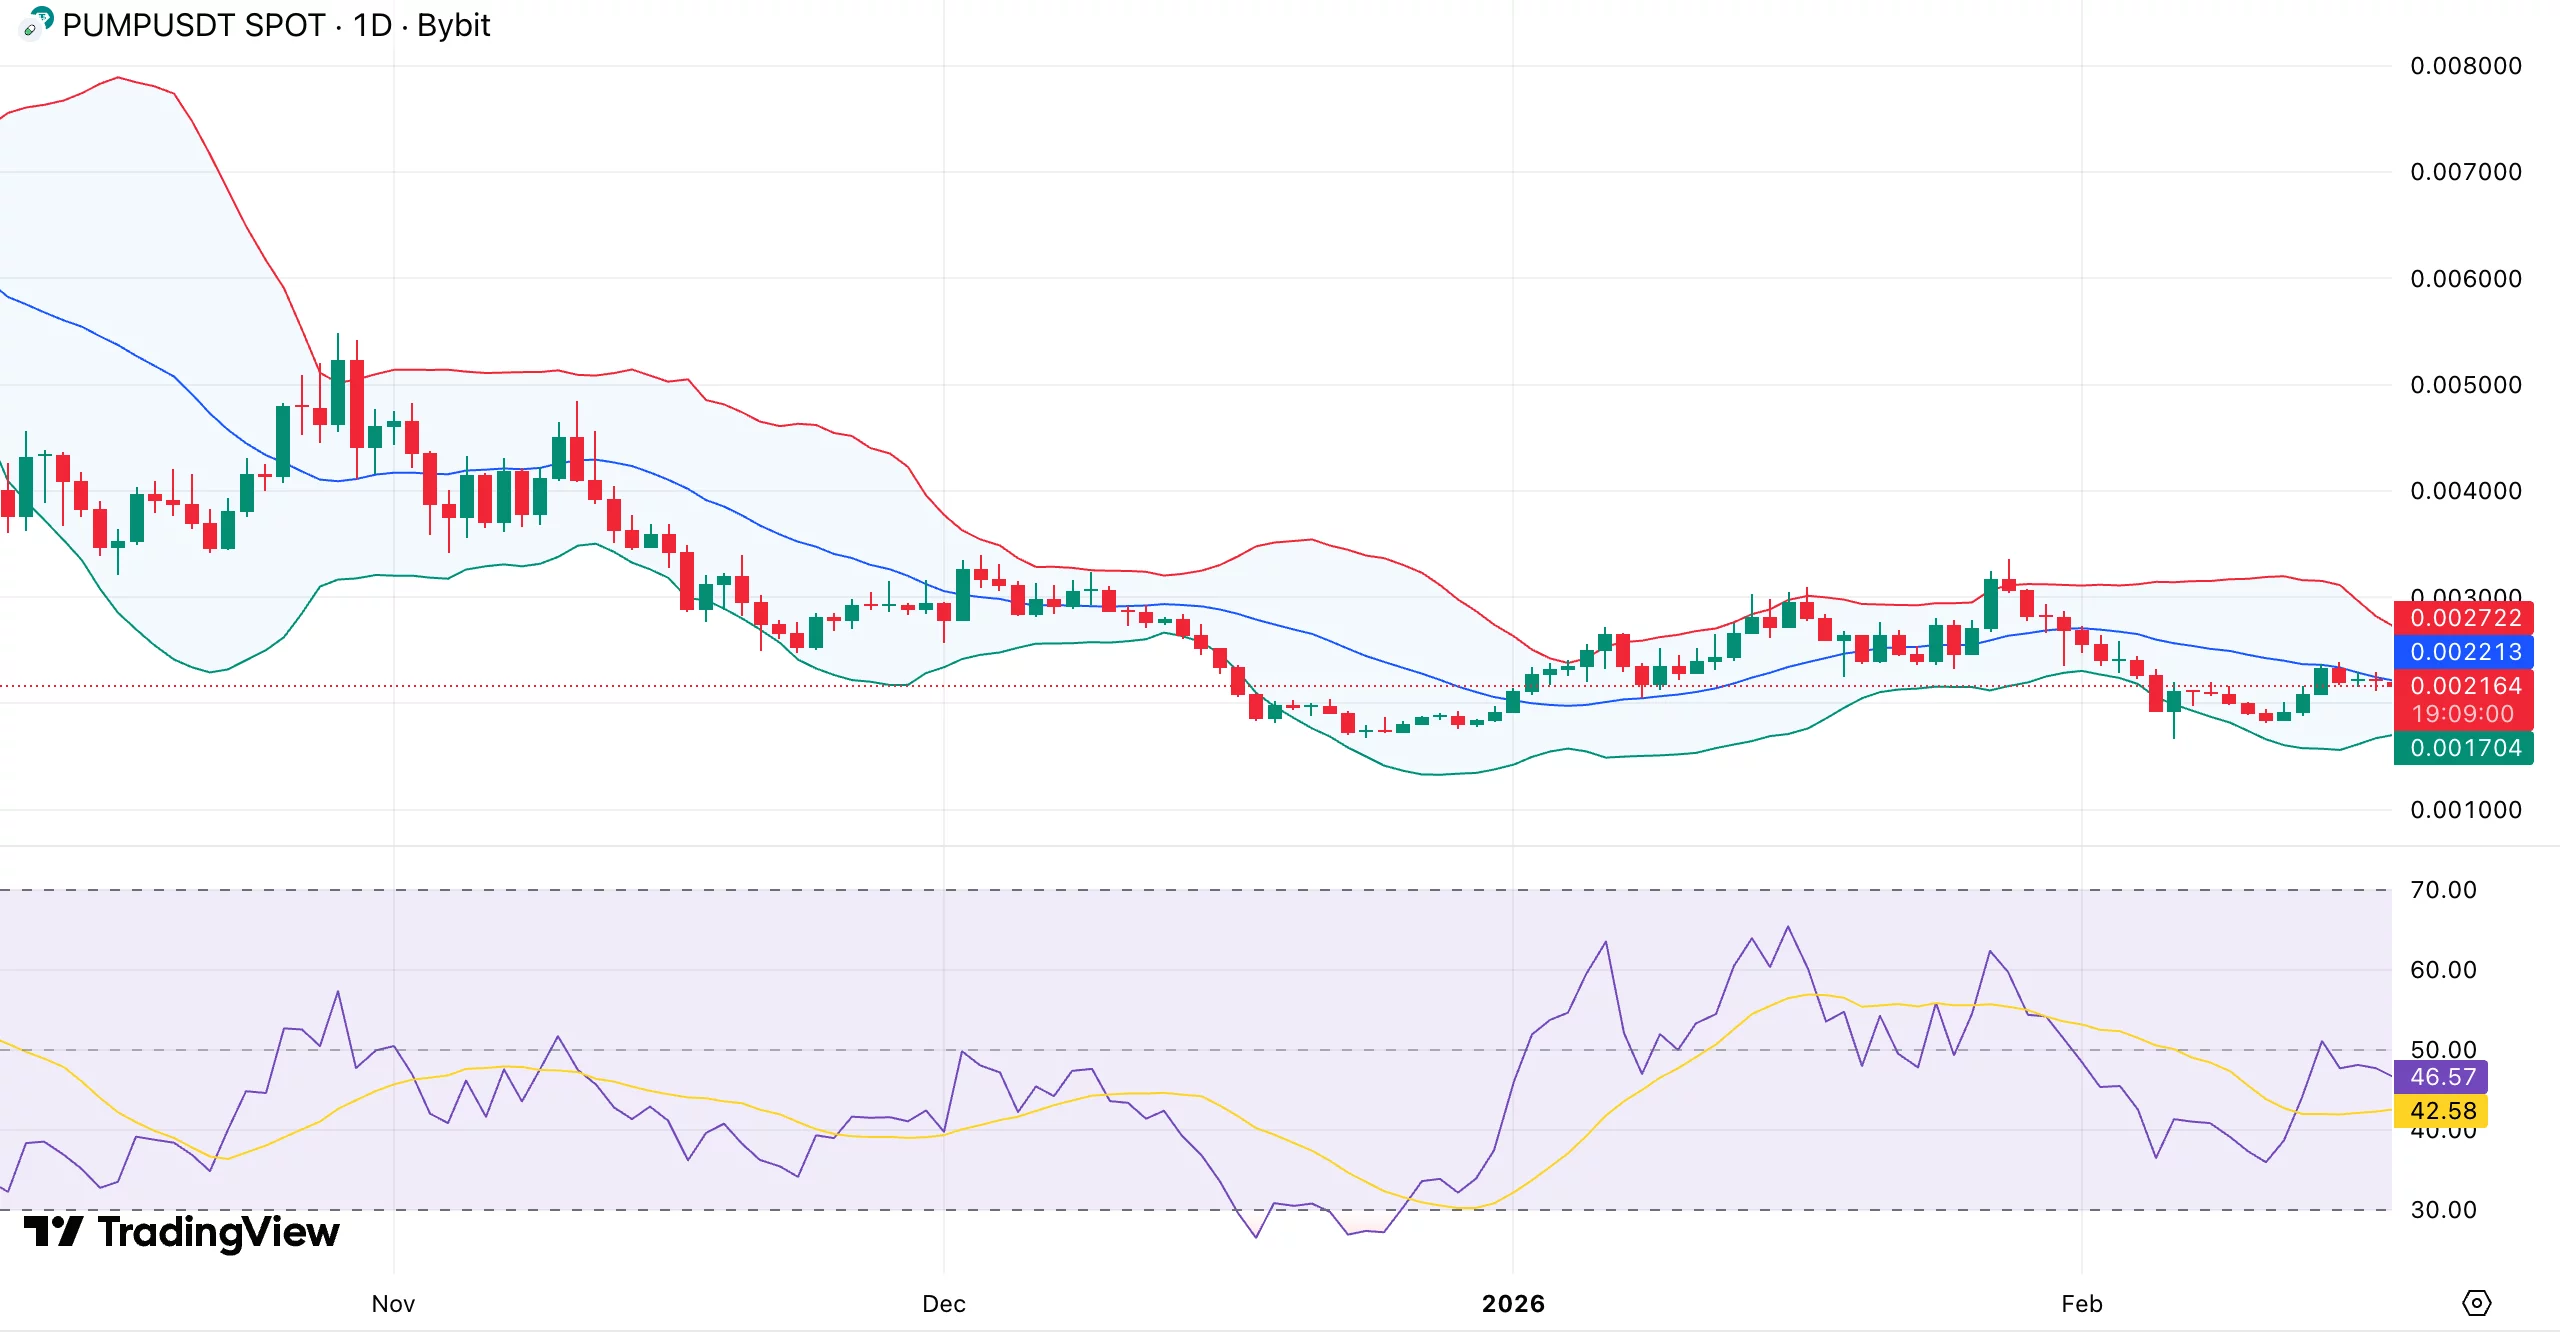
Bollinger Bands are tightening, indicating volatility contraction. When ranges narrow this way, expansion usually follows. Direction will depend on which level breaks first.
Momentum has improved but has not flipped bullish. The relative strength index is near 45, after bouncing from lower levels earlier in the month. It remains below 50, meaning buyers have not taken control.
A sustained move above 50 would strengthen upside momentum. To regain traction, bulls must close above the descending trendline and the 20-day moving average, ideally with a strong volume increase.
The immediate resistance lies around $0.0023. A breakout above that level might signal the start of a move toward the most recent high at $0.002355. A decisive decline below $0.0021 would reveal a lower liquidity pocket and shift momentum back toward sellers.