




Ethereum price traded near $2,510 on Sep. 14 as weak momentum and tighter US monetary-policy expectations prevented bulls from clearing the key $2,550 resistance level.
Summary
- Ethereum price gained about 1.4% on the daily chart but remained below the $2,550 resistance.
- The 4-hour Supertrend stayed bullish above $2,429, while ADX fell to 18.84.
- Negative Chaikin Money Flow showed that buying pressure weakened despite ETH holding above its major moving averages.
- The Fed decision and a Senate vote on US crypto legislation could determine Ethereum’s next move.
Ethereum price holds above $2,500
According to data from crypto.news, Ethereum (ETH) price opened the daily session at $2,477 and rose as high as $2,535 before trading near $2,512. The move represented a gain of about 1.4%, while an intraday low near $2,465 showed that buyers continued to defend pullbacks below $2,500.
ETH has traded sideways since its late-August rally lifted the price from below $2,000 into the $2,400–$2,550 range. Several attempts to extend the rally have stalled near the upper boundary, leaving the token without a confirmed breakout.
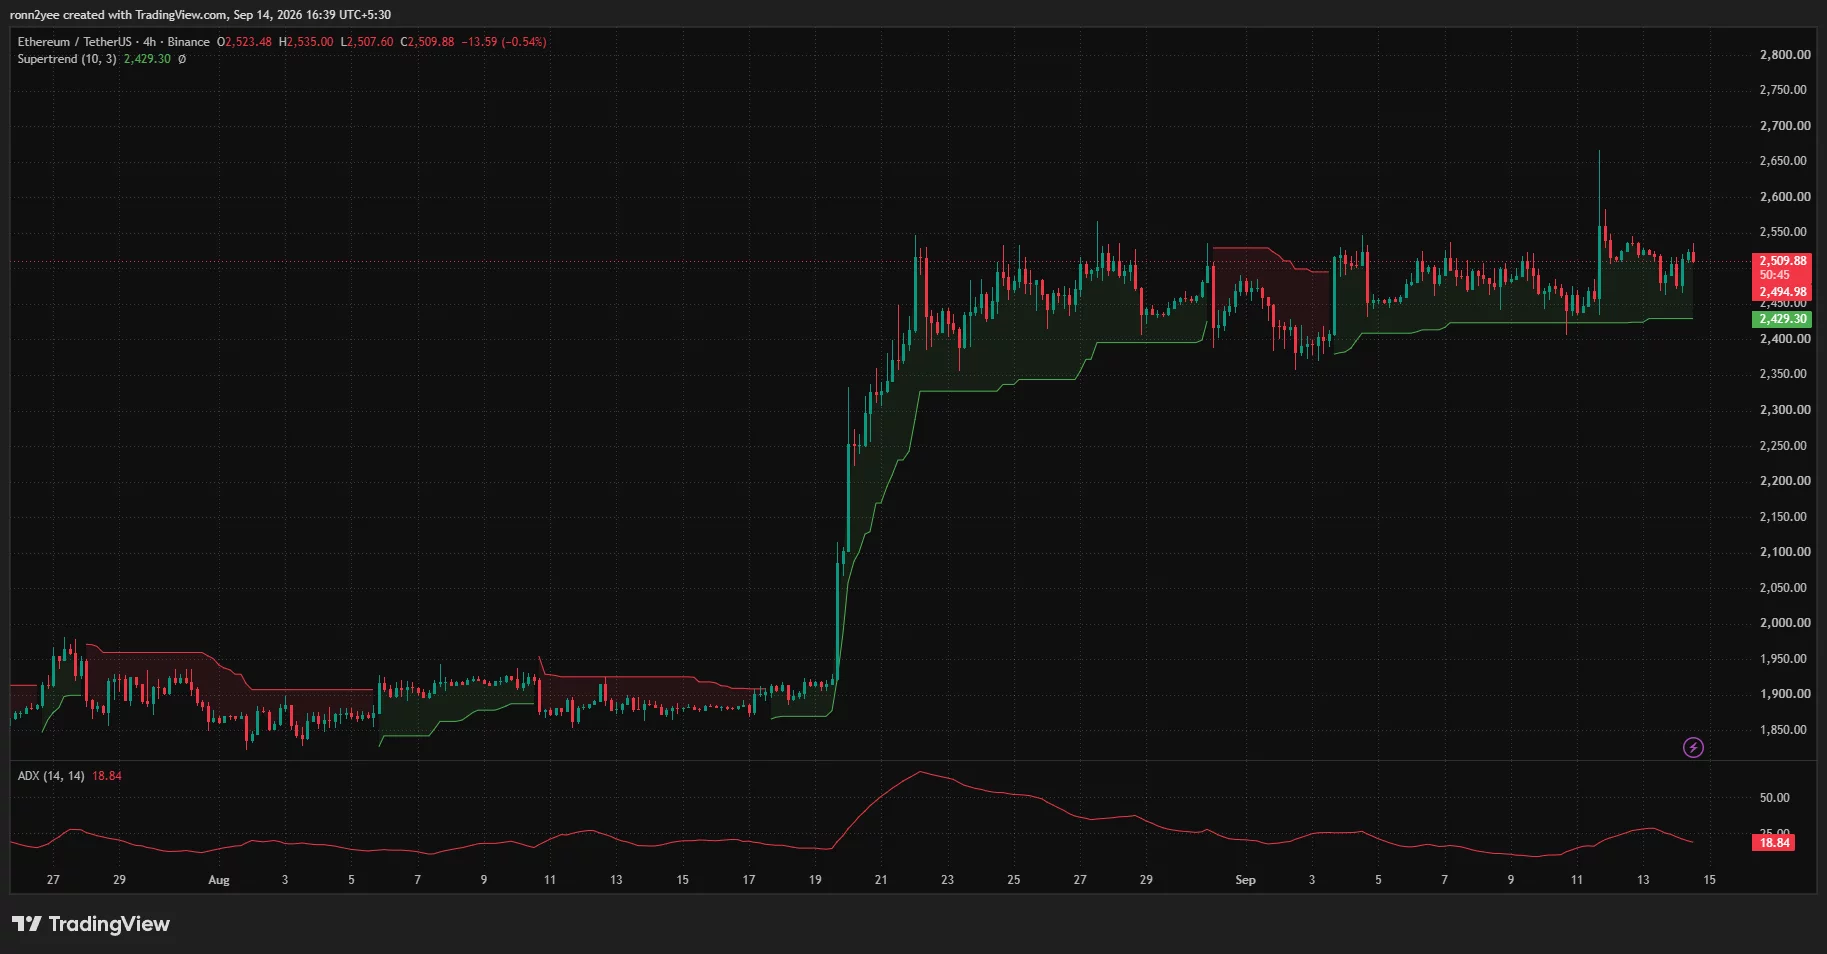
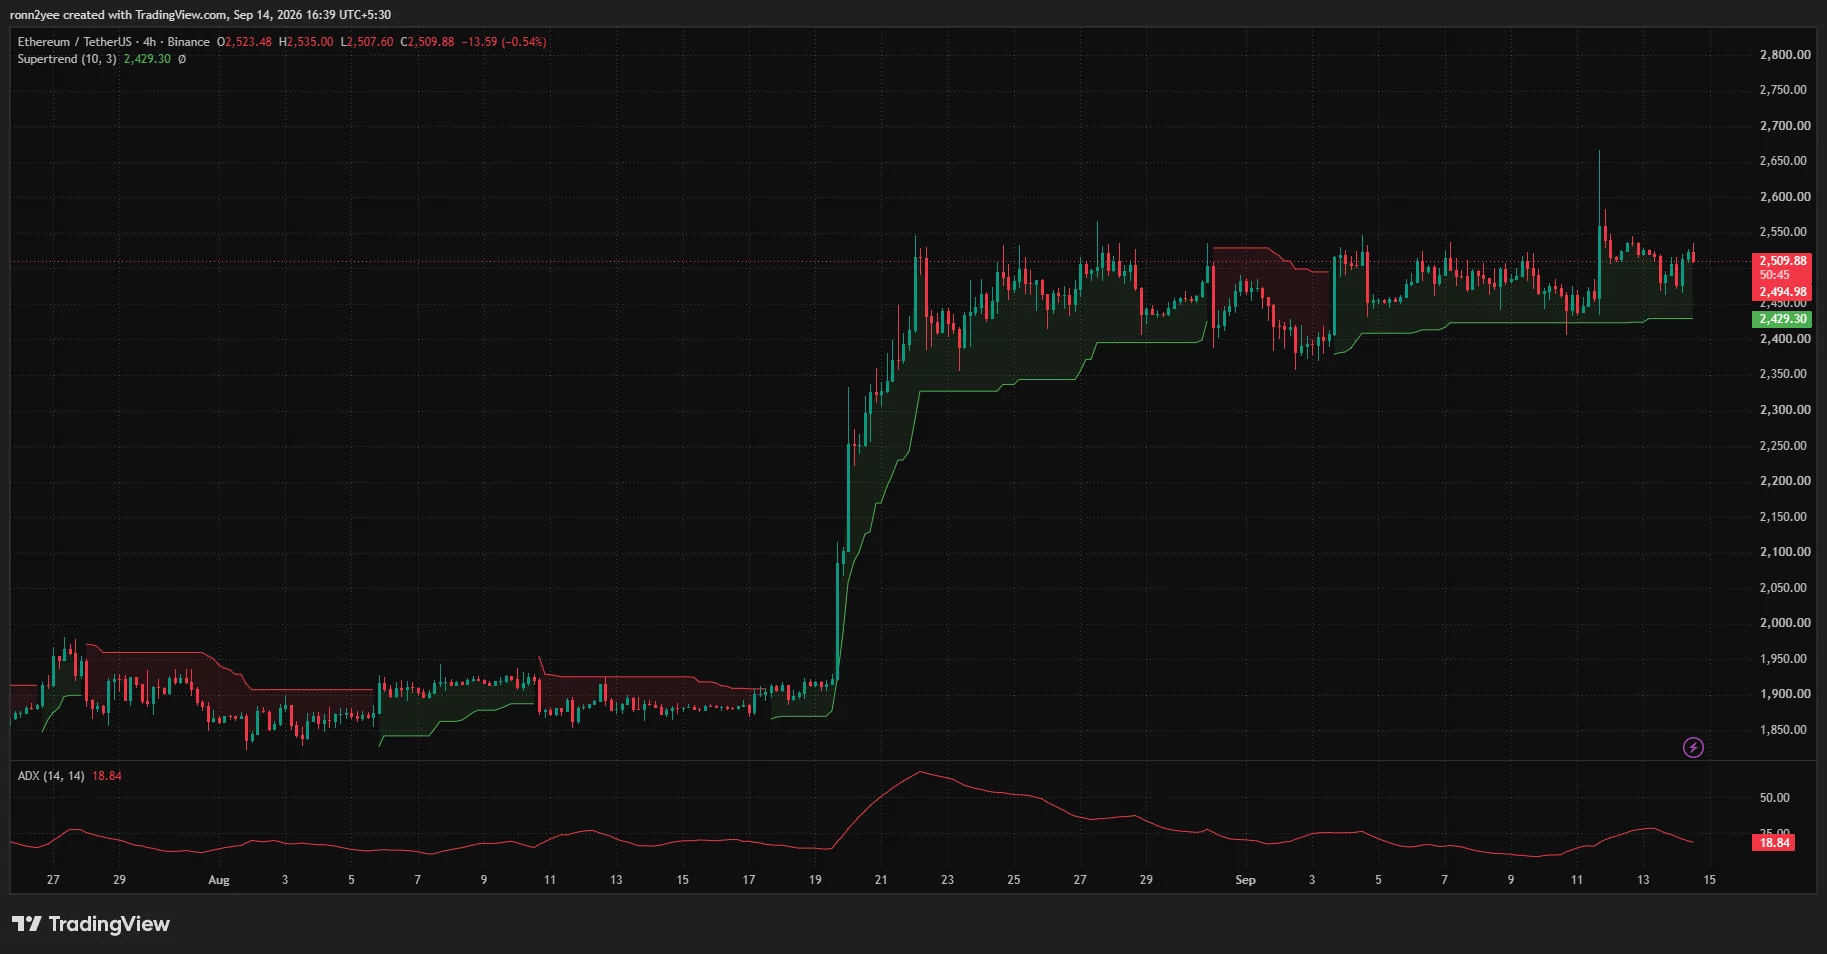
The 4-hour chart showed a similar structure. Ethereum traded near $2,510 after moving between approximately $2,465 and $2,535 during the latest session. Long upper and lower candle wicks around the range indicated that neither buyers nor sellers had established firm control.
A brief move above $2,550 on Sep. 11 reached nearly $2,670, but sellers quickly pushed the price back into the established range. A close above $2,550 remains necessary to turn that temporary liquidity sweep into a sustained continuation signal.
Weak momentum limits Ethereum breakout
Ethereum remained above every major moving average shown on the daily chart. The 20-day simple moving average stood near $2,474, creating the first dynamic support below the current price.
The wider trend also remained constructive because ETH traded above the 50-day SMA at $2,198, the 200-day SMA at $2,061, and the 100-day SMA at $1,975. The distance between the current price and those longer-term averages reflects the strength of the August recovery, but it also leaves room for a larger correction if the short-term range breaks down.
Momentum data offered a less bullish reading. The 4-hour Average Directional Index fell to 18.84. An ADX reading below 20 generally points to a weak trend, which supports the current range-bound structure rather than an immediate directional move.
Chaikin Money Flow on the daily chart stood at minus 0.06. The negative reading showed that capital outflows slightly outweighed inflows during the measured period, even as ETH remained above $2,500.
The indicators do not confirm an outright bearish reversal, but they show that Ethereum needs stronger buying volume to overcome resistance.
Ethereum must close above $2,550
The $2,535–$2,550 area remains Ethereum’s immediate resistance zone. Analyst Ted Pillows said ETH failed to close above $2,550 last week and argued that reclaiming the level could open a path toward $3,000.
Another analyst, Eliz, identified the same region as the first resistance level after an earlier long trade reached its initial target. The analyst said only a breakout from the current range would release enough liquidity for a move toward $2,700–$2,800.
A confirmed daily close above $2,550 would first expose the Sep. 11 wick near $2,670. Clearing that high could allow buyers to test $2,700 and then $2,800, although the weak ADX means the breakout would require a clear increase in volume.
On the downside, the 20-day SMA near $2,474 forms the first support. The 4-hour Supertrend remains green and provides a stronger trend boundary at approximately $2,429.
A close below $2,429 would invalidate the short-term bullish Supertrend signal and expose the $2,350–$2,400 region. The 50-day SMA near $2,198 would become the next major daily support if sellers force a wider correction.
Fed decision raises pressure on crypto
Ethereum’s range comes as US markets prepare for the Federal Reserve’s Sep. 16 policy decision. The Bureau of Labor Statistics reported that consumer prices rose 0.4% in August and 3.4% from a year earlier, strengthening expectations of another rate increase.
Money markets assigned an approximately 89% probability to a 25-basis-point hike on Sep. 14, according to Reuters. Oil prices near $108 and a stronger US dollar added pressure to risk assets by raising concerns about persistent inflation.
Higher Treasury yields can reduce demand for non-yielding and volatile assets, including ETH. However, Ethereum’s ability to remain above $2,500 despite the macro pressure suggests that traders have not yet abandoned the August recovery.
Institutional demand has also varied between sessions. US spot Ethereum ETFs recorded $34.7 million in net inflows on Sep. 9 after losing $24.3 million on Sep. 8, according to Farside Investors. The changing flows match the lack of a clear price trend.
US crypto vote could trigger volatility
Ethereum traders are also watching the US Senate’s expected consideration of crypto market-structure legislation. The measure would seek to define regulatory responsibilities and establish clearer rules for digital-asset businesses operating in the United States.
The Associated Press reported that President Donald Trump accepted most of a bipartisan ethics proposal tied to the bill, removing one source of disagreement before a crucial vote. Passage is not assured because advancing the legislation would require enough Senate support to overcome the cloture threshold.
A favorable vote could improve sentiment toward US-facing crypto assets and services, but the price charts still require confirmation. Ethereum must close above $2,550 to support targets at $2,700 and $2,800, while a loss of $2,429 would shift attention toward a deeper pullback.
Disclosure: This article does not represent investment advice. The content and materials featured on this page are for educational purposes only.
