


Bitcoin trades at $86,930 on Tuesday. BTC price dropped below the $90,000 support level for the first time in over three months, generating a negative sentiment among traders. Crypto traders have turned “fearful” after nearly six months of “neutral” and “greed,” per the Crypto Fear & Greed Index.
Amidst the Bitcoin (BTC) price correction, a new trend has emerged among institutional investors. A five-day streak of net outflows on U.S. based Spot Bitcoin ETFs raises concern among traders. Are institutional investors giving up on Bitcoin? Is the BTC bull runover? We investigate the on-chain and technical indicators to identify the next big Bitcoin trade.
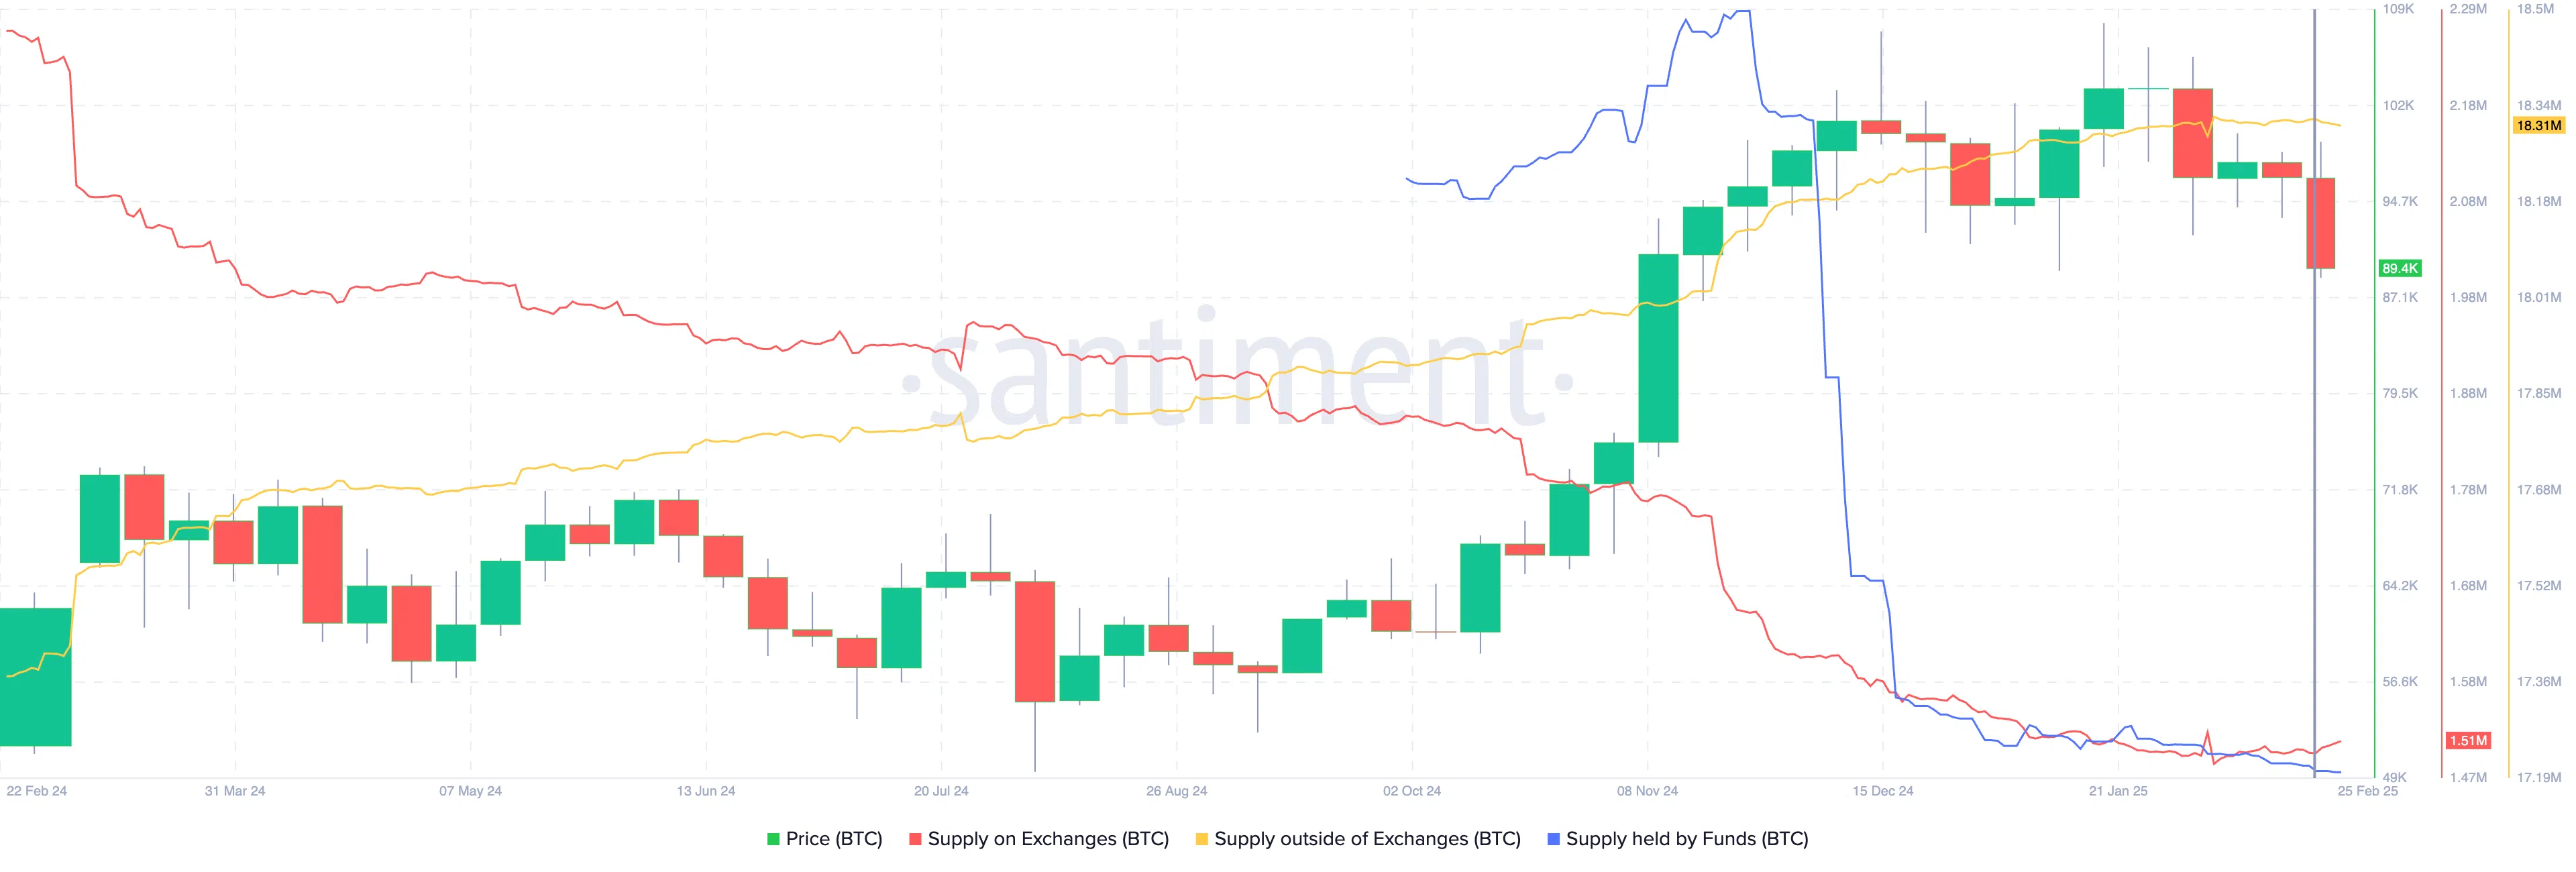
Bitcoin supply on exchanges grows while whales dump BTC
Bitcoin made headlines after hitting the $100,000 milestone and a new all-time high above $109,000. After hitting an all-time high, Bitcoin price has declined under the influence of key market movers like declining institutional investor interest, U.S. macroeconomic developments, and supply on exchanges.
On-chain data from Santiment shows that supply on exchanges is climbing at the same time as supply outside of exchanges (held by whale wallets) declines. Typically, this indicates entities holding BTC outside of exchanges are transferring holdings to exchange wallets after weeks of consistent accumulation.
Bitcoin accumulation by non-exchange wallets was considered a bullish sign for BTC, therefore a decline in non-exchange holdings is considered an expectation of further decline in Bitcoin’s price.
A key metric, BTC supply held by funds, is in decline, and this can be interpreted as a drop in Bitcoin holdings of institutions. This is consistent with spot Bitcoin net negative flows observed by Farside Investors.
Institutional investors lose interest in Bitcoin, should you be worried?
Fund flow data from CoinShares shows that institutions have pulled $595 million from Bitcoin funds month-to-date. Week-to-date a total of $571 million has been pulled from Bitcoin funds, while Ethereum, Solana, XRP and multi-asset funds see inflows.
Net week flows in crypto are dragged down by the outflows in Bitcoin-based funds. CoinShares compiled the data based on fund flows till February 21, after which the BTC supply on exchanges climbed. Bitcoin faced additional selling pressure between February 21 and 25, pushing BTC price lower, under the $90,000 support.

MicroStrategy stock tumbles, analysts at 10x Research explained the correlation between MSTR and Bitcoin’s price trend. Markus Thielen, the CEO of 10x Research explains that investors viewed MSTR as a leveraged Bitcoin call option, and failed to recognize that they were overpaying significantly, the stock traded 60% above its fair value, according to their February 24 report.
When MSTR shares peaked, the stock traded $40 billion in volume on November 21, 2024 and Thielen believes that it is likely that investors offloaded part of their positions to retail buyers. MSTR buyers are, therefore, likely sitting on significant losses — despite Bitcoin’s price remaining flat over the same period.
MSTR stock’s performance and demand therefore influence the sentiment of traders treating it as a leveraged Bitcoin call option. BTC price drop under the $90,000 level, therefore, has a critical impact on these traders and retail holders of Bitcoin as a market dynamic shift is underway.
Are whales are dumping Bitcoin
Santiment data on Bitcoin on-chain analysis shows a decline in whale transactions in two segments, valued at $100,000 or more, $1 million and higher. The downward trend in the transaction count of the two segments started on February 3.
Throughout the past two weeks, whale transactions in both segments declined, while profit-taking, measured by the Network realized profit/loss metric, continued. Whales shed their BTC holdings while taking profits. Typically, consistent profit-taking can increase the selling pressure on a token and have a negative impact on price.
The Santiment chart below shows the decline in BTC price alongside the dropping count of whale transactions and relatively high and consistent profit-taking by Bitcoin traders.

The next big Bitcoin trade
Bitcoin price slipped under key support at the $90,000 level on Tuesday. At the time of writing, BTC trades at $88,976.24. The technical indicators on the Bitcoin price chart support further correction in Bitcoin price.
Three key support levels that BTC could bounce from are S1, S2, and S3 at $85,072, $81,500, and $76,900. These three support levels coincide with the upper/lower boundaries of fair value gaps on the BTC/USDT daily price chart.
The next key support after $90,000 is the pre-election level of $70,577. A breakdown of this support could send Bitcoin to collect liquidity at $67,476. The likelihood of a massive drawdown in Bitcoin is less likely, but February opened with a flashcrash to the $91,230 low on the third.
BTC is currently 12% below its $100,000 milestone, and sufficient buying pressure and positive macroeconomic developments could push the token higher.

Markus Thielen of 10xResearch presents his technical perspective on Bitcoin price in the latest publication on February 25.
In the report, Thielen explains that from a technical analysis perspective, Bitcoin appears to be trading within an Ascending Broadening Wedge pattern.

Thielen’s three key observations are the widening price action, a wedge-like shape that has emerged in Bitcoin price chart, a partial rise and a setup that suggests correction is impending and a pattern that forms at the end of the prolonged uptrend.
Thielen says:
“If Bitcoin follows the expected outcome of this pattern, a downside breakout could occur. However, confirmation from volume trends and further price action would be necessary before drawing definitive conclusions.”
Ilman Shazhaev, Founder & CEO of Dizzaract discussed Bybit’s hack and the impact on Bitcoin price. Shazhaev told Crypto.news in an exclusive interview:
“The Bybit hack has proven that communities can work together on a single mission. The Lazarus Group disrupted the trading platform when it laundered a total of 401,346 ETH stolen, valued at approximately $1.4 billion. Despite the mild retracement recorded over the weekend, negative sell pressure remains in the market. However, the sentiment in the market now is beyond the Bybit hack.
The exchange said it has fully replenished its Ethereum reserve and fulfilled all users’ withdrawals. Though the funds came from loans from industry partners and OTC purchases, it has helped Bybit withstand an unusual bank run that saw exchanges like FTX declare bankruptcy. The unity in the market has further placed the broader industry in a positive light, thus showing that the current price action will likely not last for long.”
Dr. Sean Dawson, Head of Research at Derive.xyz commented on the bearish shift as institutional funds exit their positions in Bitcoin. Dr.Dawson told Crypto.news:
“Bitcoin has seen a 4.5% drop in the last 24 hours, most likely due to the continued exodus of institutional funds from major BTC ETFs. Over the past three weeks, more than $900 million in net BTC ETF outflows have been recorded. Investors are pulling funds in the face of macroeconomic volatility, including concerns around the Trump presidency, the Ukraine, China and Gaza conflicts, and the potential for rising interest rates.
As a result, the chance of BTC settling above $100K by the end of March 28 has fallen to 30%, down from 39% just 24 hours ago. Additionally, the probability of BTC reaching $125K by June 27 has dropped from 19% to 15%.”
On the decentralized options platform, traders reacted to recent developments by adjusting their positions with a slight increase in BTC 7-day at-the-money implied volatility (ATM IV), now sitting at 46%. The statistic reflects a heightened market uncertainty in Bitcoin price.
Disclosure: This article does not represent investment advice. The content and materials featured on this page are for educational purposes only.