Close Menu

    Subscribe to Updates

    What's Hot

    Top 7 Paid MCP Servers in 2025

    June 30, 2025

    Wall Street split on Circle stock as JPMorgan, Goldman warn on valuation

    June 30, 2025

    SOL spot ETF with staking could go live this week, expert says

    June 30, 2025
    Facebook X (Twitter) Instagram
    laicryptolaicrypto
    Demo
    • Ethereum
    • Crypto
    • Altcoins
    • Blockchain
    • Bitcoin
    • Lithosphere News Releases
    laicryptolaicrypto
    Home Trump meme coin price forms a bullish pattern; can it rise 56%?
    Crypto

    Trump meme coin price forms a bullish pattern; can it rise 56%?

    John SmithBy John SmithFebruary 12, 2025No Comments2 Mins Read
    Share
    Facebook Twitter LinkedIn Pinterest Email


    Official Trump has imploded and is hovering near its all-time low as most meme coins and other cryptocurrencies fell.

    The Official Trump (TRUMP) oken dropped to $14.85 on Feb. 12, down more than 80% from its January peak. Its market cap has fallen from over $15 billion in January to $2.9 billion today.

    Most meme coins have retreated in the past few weeks. Dogecoin (DOGE) price has dropped by 25% in the last 30 days, while Shiba Inu (SHIB) is down by over 28%. Other coins like Pudgy Penguins, Dogwifhat, and Bonk have all fallen by double-digits.

    The Official Trump token has crashed as many early buyers dumped their holdings. Nansen data shows that most profit-leading traders have offloaded their tokens, leaving retail investors holding the bag.

    This is a common pattern in the meme coin industry, where developers pump their tokens, attract FOMO investors, and then dump them. A similar scenario recently unfolded with ai16z and Virtuals Protocol.

    Official Trump meme coin price technical analysis
    Trump meme coin price forms a bullish pattern; can it rise 56%? - 1
    Trump meme coin price chart | Source: crypto.news

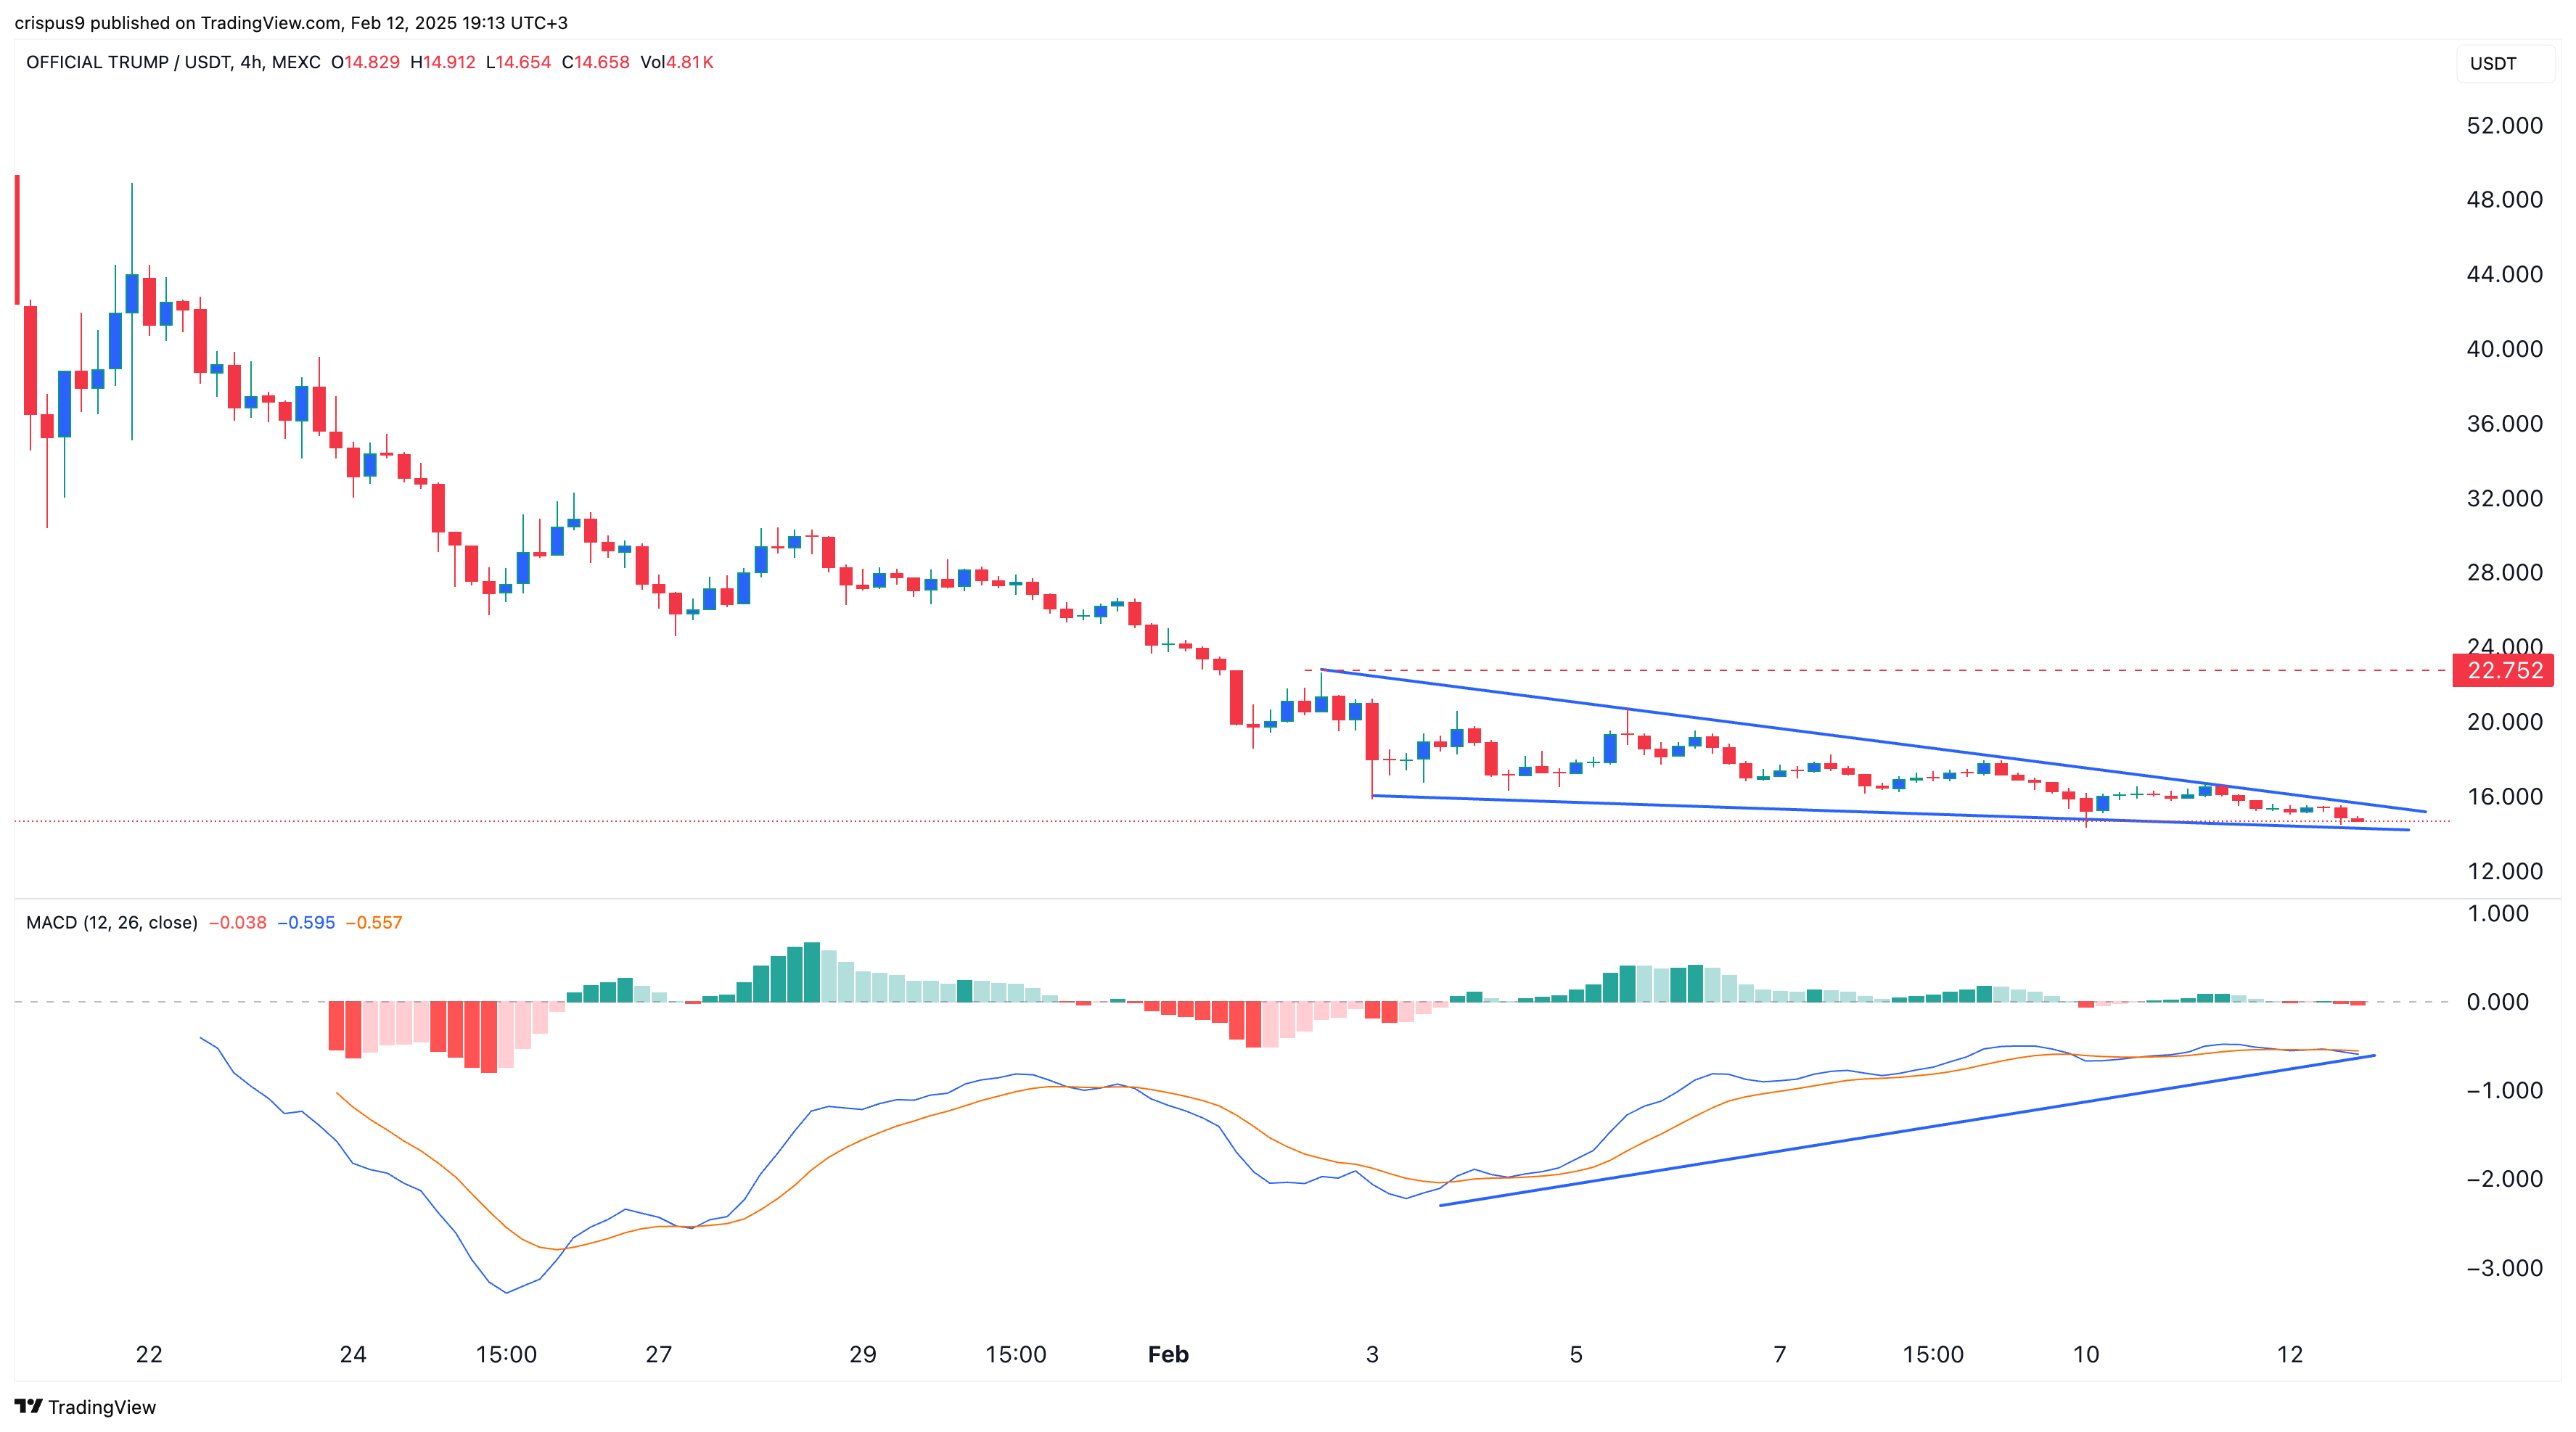
    Technical indicators suggest a potential Official Trump token rebound in the coming days. The token has formed a falling wedge pattern, a popular bullish signal. The upper trendline of the wedge connects the highest swings since Feb. 2, while the lower trendline marks the lowest swings since Feb. 3.

    The two trendlines are nearing their convergence point, indicating that a bullish breakout may occur in the coming weeks.

    Additionally, the MACD indicator has formed a bullish divergence pattern. This occurs when the two MACD lines are rising while the price continues to fall. Given this setup, there is a strong possibility that the Official Trump token will rebound and potentially retest the $22.75 resistance level—55% above its current price.



    Source link

    Share. Facebook Twitter Pinterest LinkedIn WhatsApp Reddit Tumblr Email
    John Smith

    Related Posts

    Top 7 Paid MCP Servers in 2025

    June 30, 2025

    Wall Street split on Circle stock as JPMorgan, Goldman warn on valuation

    June 30, 2025

    SOL spot ETF with staking could go live this week, expert says

    June 30, 2025
    Leave A Reply Cancel Reply

    Demo
    Don't Miss
    Crypto

    Top 7 Paid MCP Servers in 2025

    By John SmithJune 30, 20250

    The landscape of artificial intelligence (AI) development has seen remarkable growth, with 2025 marking a…

    Wall Street split on Circle stock as JPMorgan, Goldman warn on valuation

    June 30, 2025

    SOL spot ETF with staking could go live this week, expert says

    June 30, 2025

    Investors could turn $100 into $10,000

    June 30, 2025

    LAI Crypto is a user-friendly platform that empowers individuals to navigate the world of cryptocurrency trading and investment with ease and confidence.

    Our Posts
    • Altcoins (608)
    • Bitcoin (30)
    • Blockchain (143)
    • Crypto (9,236)
    • Ethereum (628)
    • Lithosphere News Releases (160)

    Subscribe to Updates

    • Twitter
    • Instagram
    • YouTube
    • LinkedIn

    Type above and press Enter to search. Press Esc to cancel.