


Ethereum’s correction appears to be accelerating, with price sliding toward the critical $1,900 support level and futures sentiment hitting its most bearish reading in three months.
Summary
- Ethereum price is under pressure across all major timeframes, with structure still tilted to the downside.
- Futures traders are increasingly defensive, as aggressive selling begins to dominate derivatives flows.
- The $1,900 level now stands as a pivotal support; holding it could stabilize price, while a break may accelerate losses.
At press time, Ethereum was changing hands at $1,958, marking a 6.4% drop in the last 24 hours as continued selling dragged prices lower. Over the past week, the coin has fluctuated between $1,907 and $2,129, but it has stayed under pressure across every major timeframe.
In the last seven days, Ethereum (ETH) has slipped 6.3%. The losses deepen when you zoom out. It is down 40% over the past month and 27% compared with a year ago, showing how strong and persistent this correction has been.
Trading activity in the spot market picked up as prices fell. During the sell-off, 24-hour volume jumped 34% to reach $31 billion, suggesting that more traders stepped in while the price tested important support levels.
Derivatives, on the other hand, tells a more cautious story, pointing to a market that remains on edge. As per CoinGlass data, derivatives volume rose 18% to $40 billion while open interest dropped 7% to $23 billion. This combination suggests that traders are closing positions into volatility rather than adding fresh leverage.
Futures sentiment flips extremely bearish
Additional pressure is coming from longer-term derivatives sentiment. A Feb. 15 analysis by CryptoQuant contributor CryptoOnchain revealed a notable shift in futures behavior on Binance. The Ethereum Taker Buy/Sell Ratio (30-day moving average) has dropped to 0.97, its lowest reading since November 2025.
When this ratio drops below 1.00, it shows that aggressive sell orders are outpacing aggressive buys. Using a 30-day average helps filter out daily fluctuations, turning this into a structural signal rather than a short-term reaction.
At the current levels, the data indicate that futures traders have been leaning on the sell side for several weeks, either hedging their exposure or taking a defensive stance as prices weaken.
If spot market demand is unable to absorb the supply close to support, this ongoing imbalance raises the possibility of prolonged consolidation or additional losses, but it does not guarantee that prices will continue to decline right away.
Ethereum price technical analysis
Ethereum is still clearly in a downward trend. Since late December, there have been consistently lower highs and lower lows, suggesting that the correction is still ongoing. Sellers continue to dominate the market, as shown by the price remaining below the 20-day moving average.
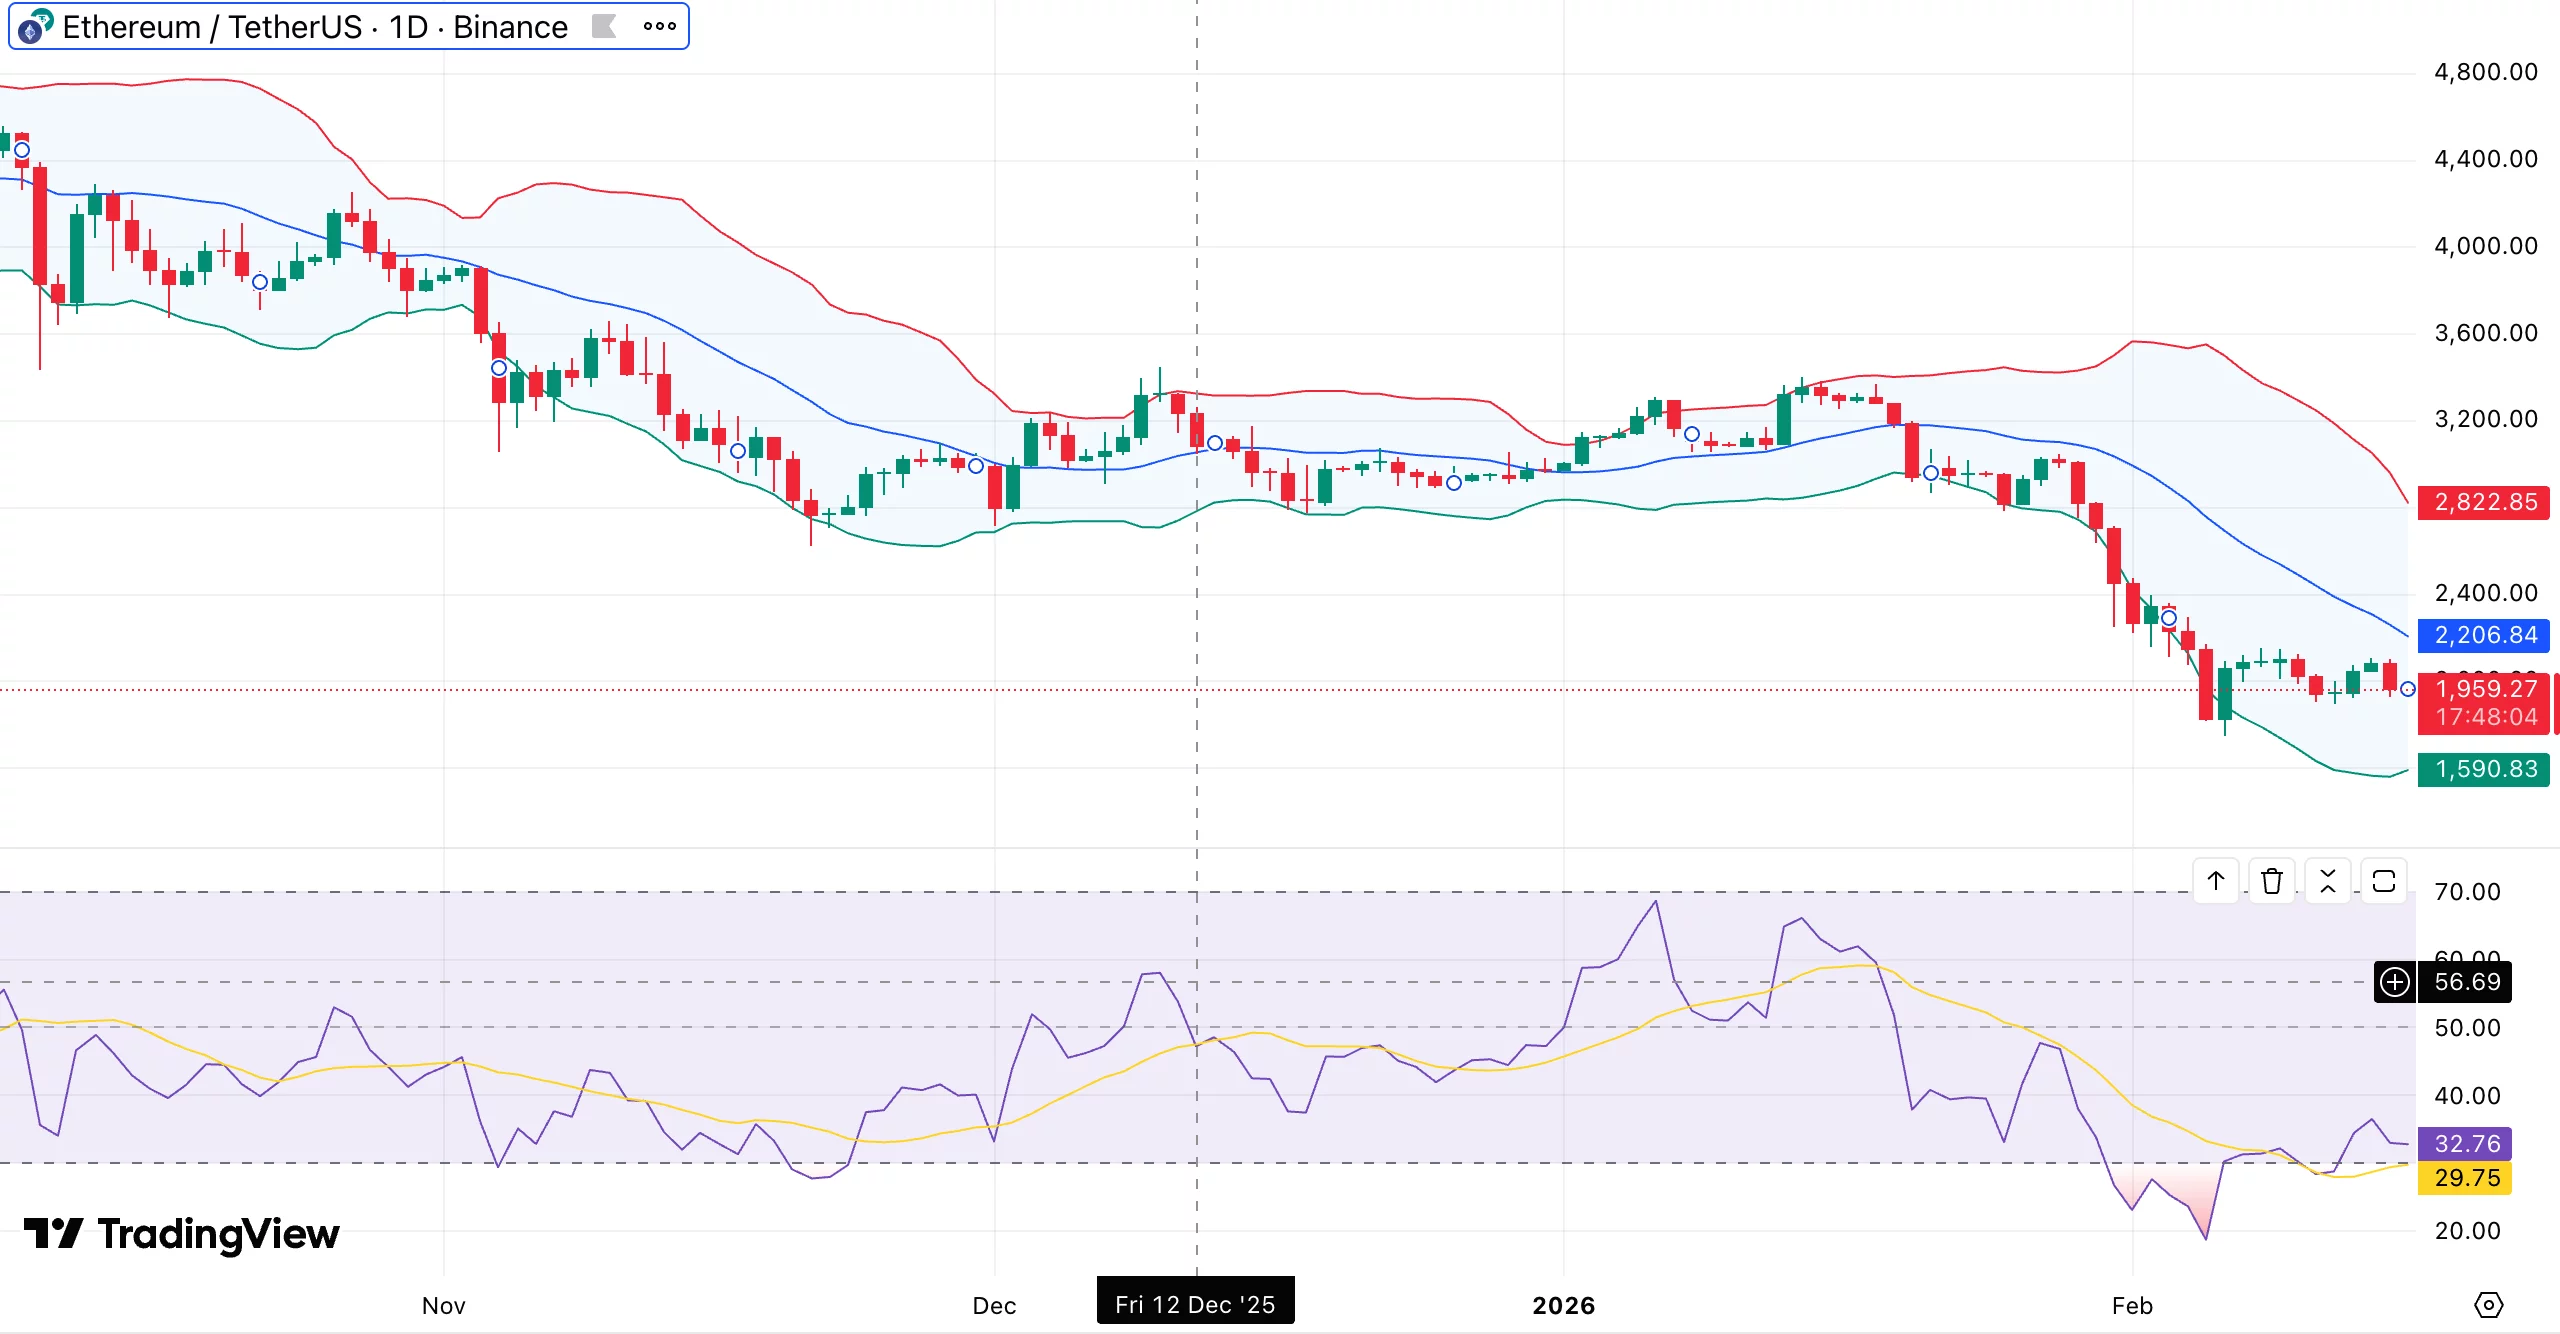
Volatility has spiked sharply. The recent downturn pushed ETH close to the lower Bollinger Band around $1,600, with the bands widening, a classic sign of a strong directional move. Despite a minor recovery from that extreme, the price is still trading close to the lower half of the range, suggesting that selling pressure has lessened but not reversed.
A crucial psychological and technical level is now the $1,900 mark. It lines up with a previous consolidation zone where buyers once tried to stabilize prices. If Ethereum breaks below this level decisively, it could drop toward $1,600–$1,650, near the lower edge of the recent volatility range.
Momentum readings remain weak. The relative strength index sits around 32–33, recently brushing near oversold territory. Such levels sometimes trigger short-term rallies, but no bullish divergence has appeared. Throughout the correction, RSI has failed to climb back above 50, keeping overall momentum firmly in the bearish camp.
For bulls to regain control, a daily close holding above $1,900 and RSI pushing back into the 40–45 range would be necessary. If $1,900 fails, downside risk remains elevated.
A move toward $1,600, and potentially lower, would be consistent with both the current technical structure and further bearish tilt in futures sentiment.