



Ethereum price remained trapped near $1,920 on July 30 as resistance below $2,000, restrictive US monetary policy, delayed crypto legislation, and broader market fear limited demand.
Summary
- Ethereum price traded near $1,922, below resistance around $1,938 and the psychological $2,000 level.
- 4-hour momentum remains constructive, but a negative CMF reading shows weak capital inflows.
- US spot Ethereum ETFs recorded $18.65 million in net outflows on July 29.
- Fed policy, the delayed CLARITY Act, and geopolitical risks are discouraging aggressive risk-taking.
Ethereum price consolidates below $2,000
According to data from crypto.news, Ethereum (ETH) price was trading around $1,922 at the time of writing, up roughly 0.6% on the daily chart but still unable to turn its July recovery into a clean breakout.
The token has spent several sessions consolidating below $2,000 after briefly reaching the $1,970–$1,980 area earlier in the week. Sellers repeatedly appeared near the upper end of that range, preventing ETH from challenging the psychological threshold.
The daily chart places immediate resistance near $1,938, an area that previously acted as support in February and March. Ethereum’s latest candles have formed directly below that level, suggesting buyers and sellers are waiting for a stronger catalyst before taking control.
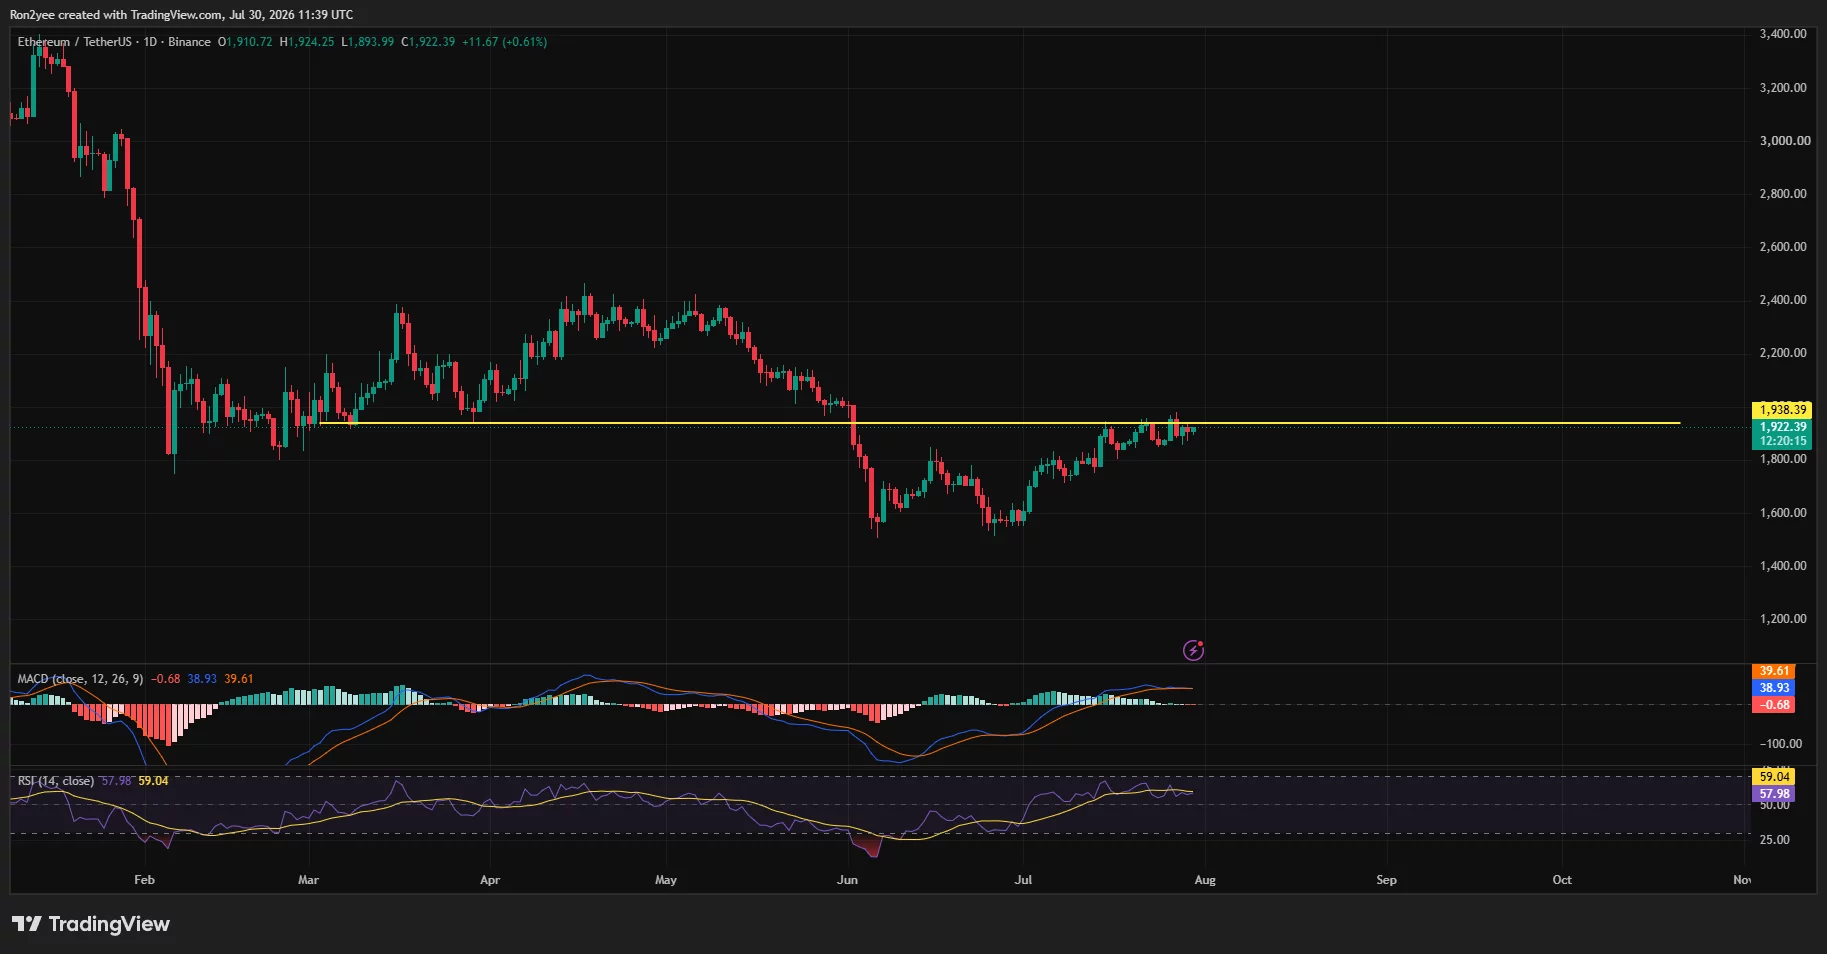
Momentum has also started to flatten. The daily relative strength index stood near 58, keeping ETH above neutral territory but below overbought levels. The MACD remained positive, although its lines were converging and the histogram had slipped slightly below zero.
These signals point to consolidation rather than a confirmed bearish reversal. However, they also show that the recovery from June’s low near $1,530 has lost momentum as ETH approaches heavier overhead supply.
Macro fear is limiting risk appetite
Ethereum’s stalled breakout follows the Federal Reserve’s decision to maintain its benchmark interest rate at 3.5%–3.75%. Although the decision was widely expected, it gave investors little reason to increase exposure to high-beta assets.
Three Federal Open Market Committee members voted for a quarter-point rate increase, showing that inflation remains a concern inside the central bank. Chair Kevin Warsh also reaffirmed the Fed’s commitment to returning inflation to its 2% target, leaving open the risk of tighter policy if price pressures persist. The Federal Reserve’s statement confirmed the 9–3 decision.
Higher rates increase the relative appeal of interest-bearing assets while raising the opportunity cost of holding cryptocurrencies. The effect is especially important for Ethereum because its recent recovery has depended partly on investors becoming more willing to move back into risk assets.
Geopolitical pressure has added another layer of uncertainty. Brent crude jumped more than 7% on Wednesday amid renewed US-Iran tensions, while the Dow fell 2.2%, the S&P 500 lost 1.5%, and the Nasdaq declined 1.7%. The combination of rising energy prices and weaker equities raised fresh concerns that inflation could remain elevated.
The crypto market’s broader mood reflects that caution. The Fear and Greed Index remained in the “Fear” category on July 30, showing that traders have yet to regain confidence despite ETH’s recovery from its June low.
CLARITY Act delay removes a crucial catalyst
Regulatory uncertainty is also weighing on Ethereum indirectly. The US Senate has postponed work on the Digital Asset Market Clarity Act while lawmakers prioritize a Russia sanctions package and federal nominations.
The delay reduces the likelihood of meaningful progress before the Senate’s August recess. The bill is intended to clarify how the Securities and Exchange Commission and Commodity Futures Trading Commission divide oversight of digital assets.
Ethereum already has access to regulated US spot exchange-traded funds, but wider market-structure rules could encourage exchanges, brokers, and institutions to expand their crypto operations. Delaying those rules leaves investors without a near-term regulatory catalyst.
According to data from SoSoValue, US spot Ethereum ETFs recorded approximately $18.65 million in net outflows on July 29, reversing the previous session’s inflow. The withdrawal was modest compared with the funds’ recent weekly gains, but it showed that institutional demand was not strong enough to force ETH through $2,000 during the latest attempt.
Ethereum breakout needs stronger capital inflows
Ethereum’s 4-hour chart remains more constructive than the macro backdrop. ETH was trading above its 20-period, 50-period, 100-period, and 200-period simple moving averages, which stood near $1,913, $1,903, $1,889, and $1,801, respectively.
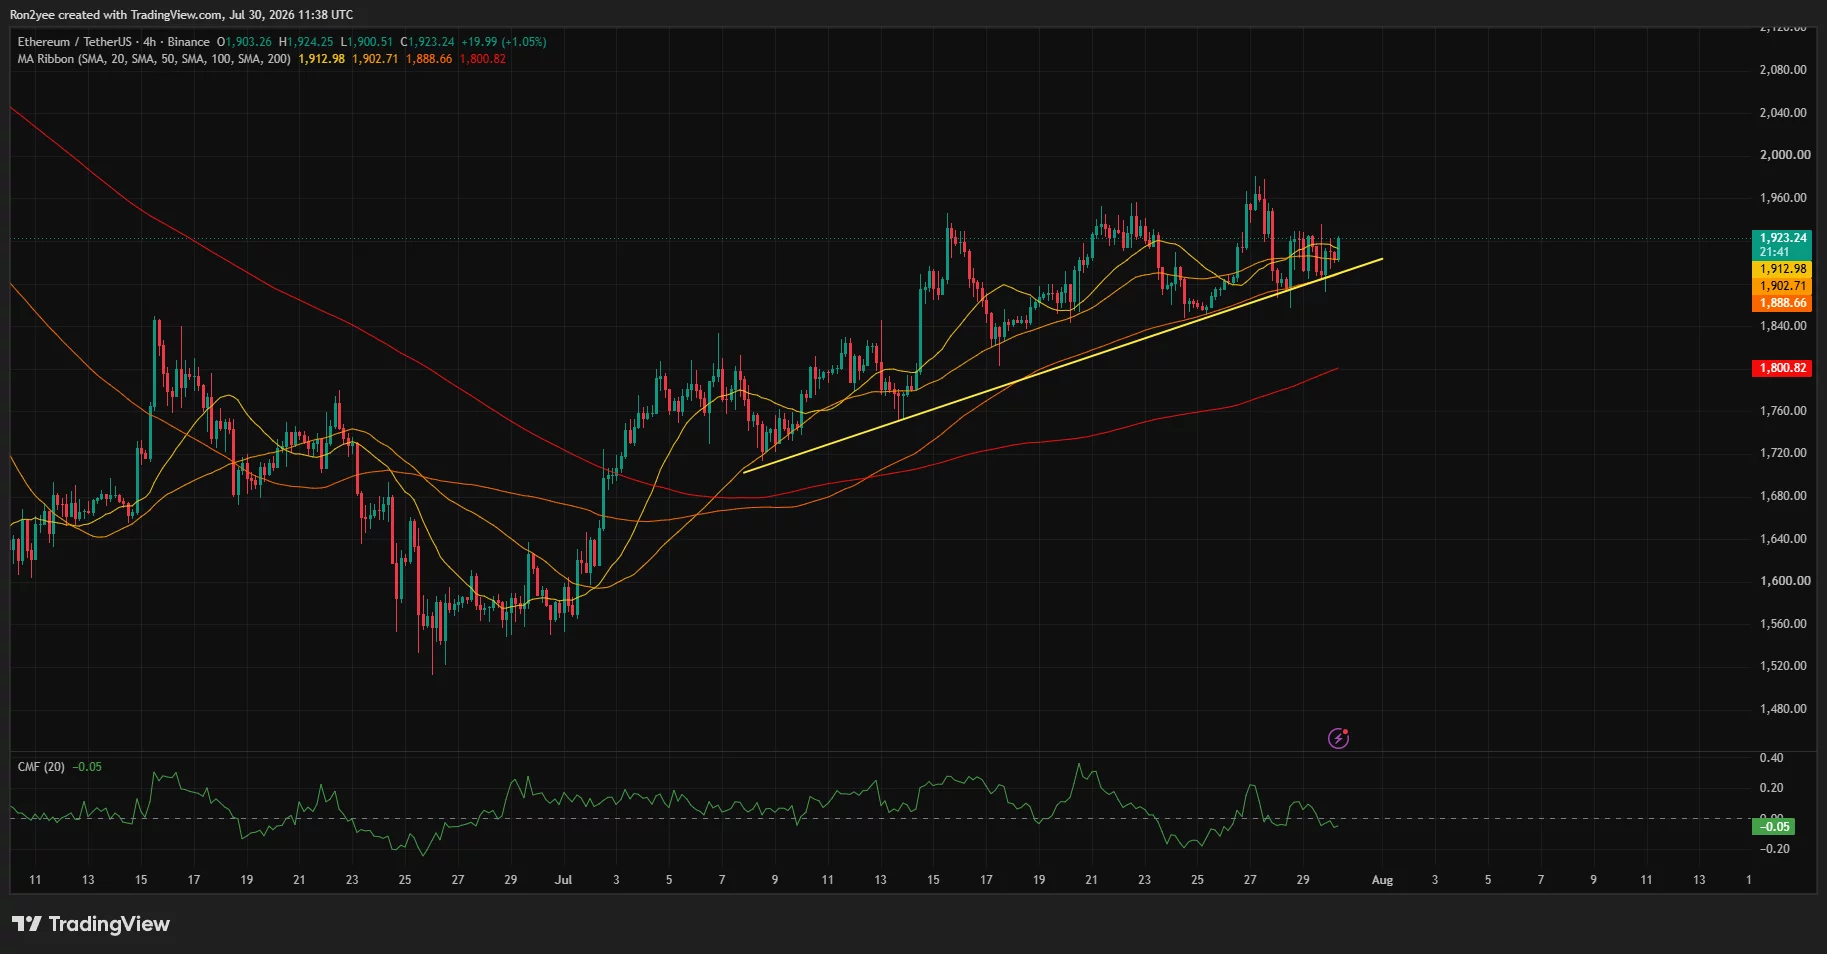
An ascending trendline also continues to support the recovery. That structure gives buyers a path toward $1,960 and $2,000 as long as ETH holds above the $1,888–$1,900 region.
However, the Chaikin Money Flow indicator stood at minus 0.05. A negative reading means capital flow has not confirmed the rising price structure, increasing the risk that another push toward resistance will fade without stronger spot demand.
The liquidation heatmap shows a concentrated liquidity pocket near $1,940, followed by a wider cluster around $1,980–$2,000. A move through $1,940 could therefore trigger short liquidations and pull ETH toward the psychological barrier.
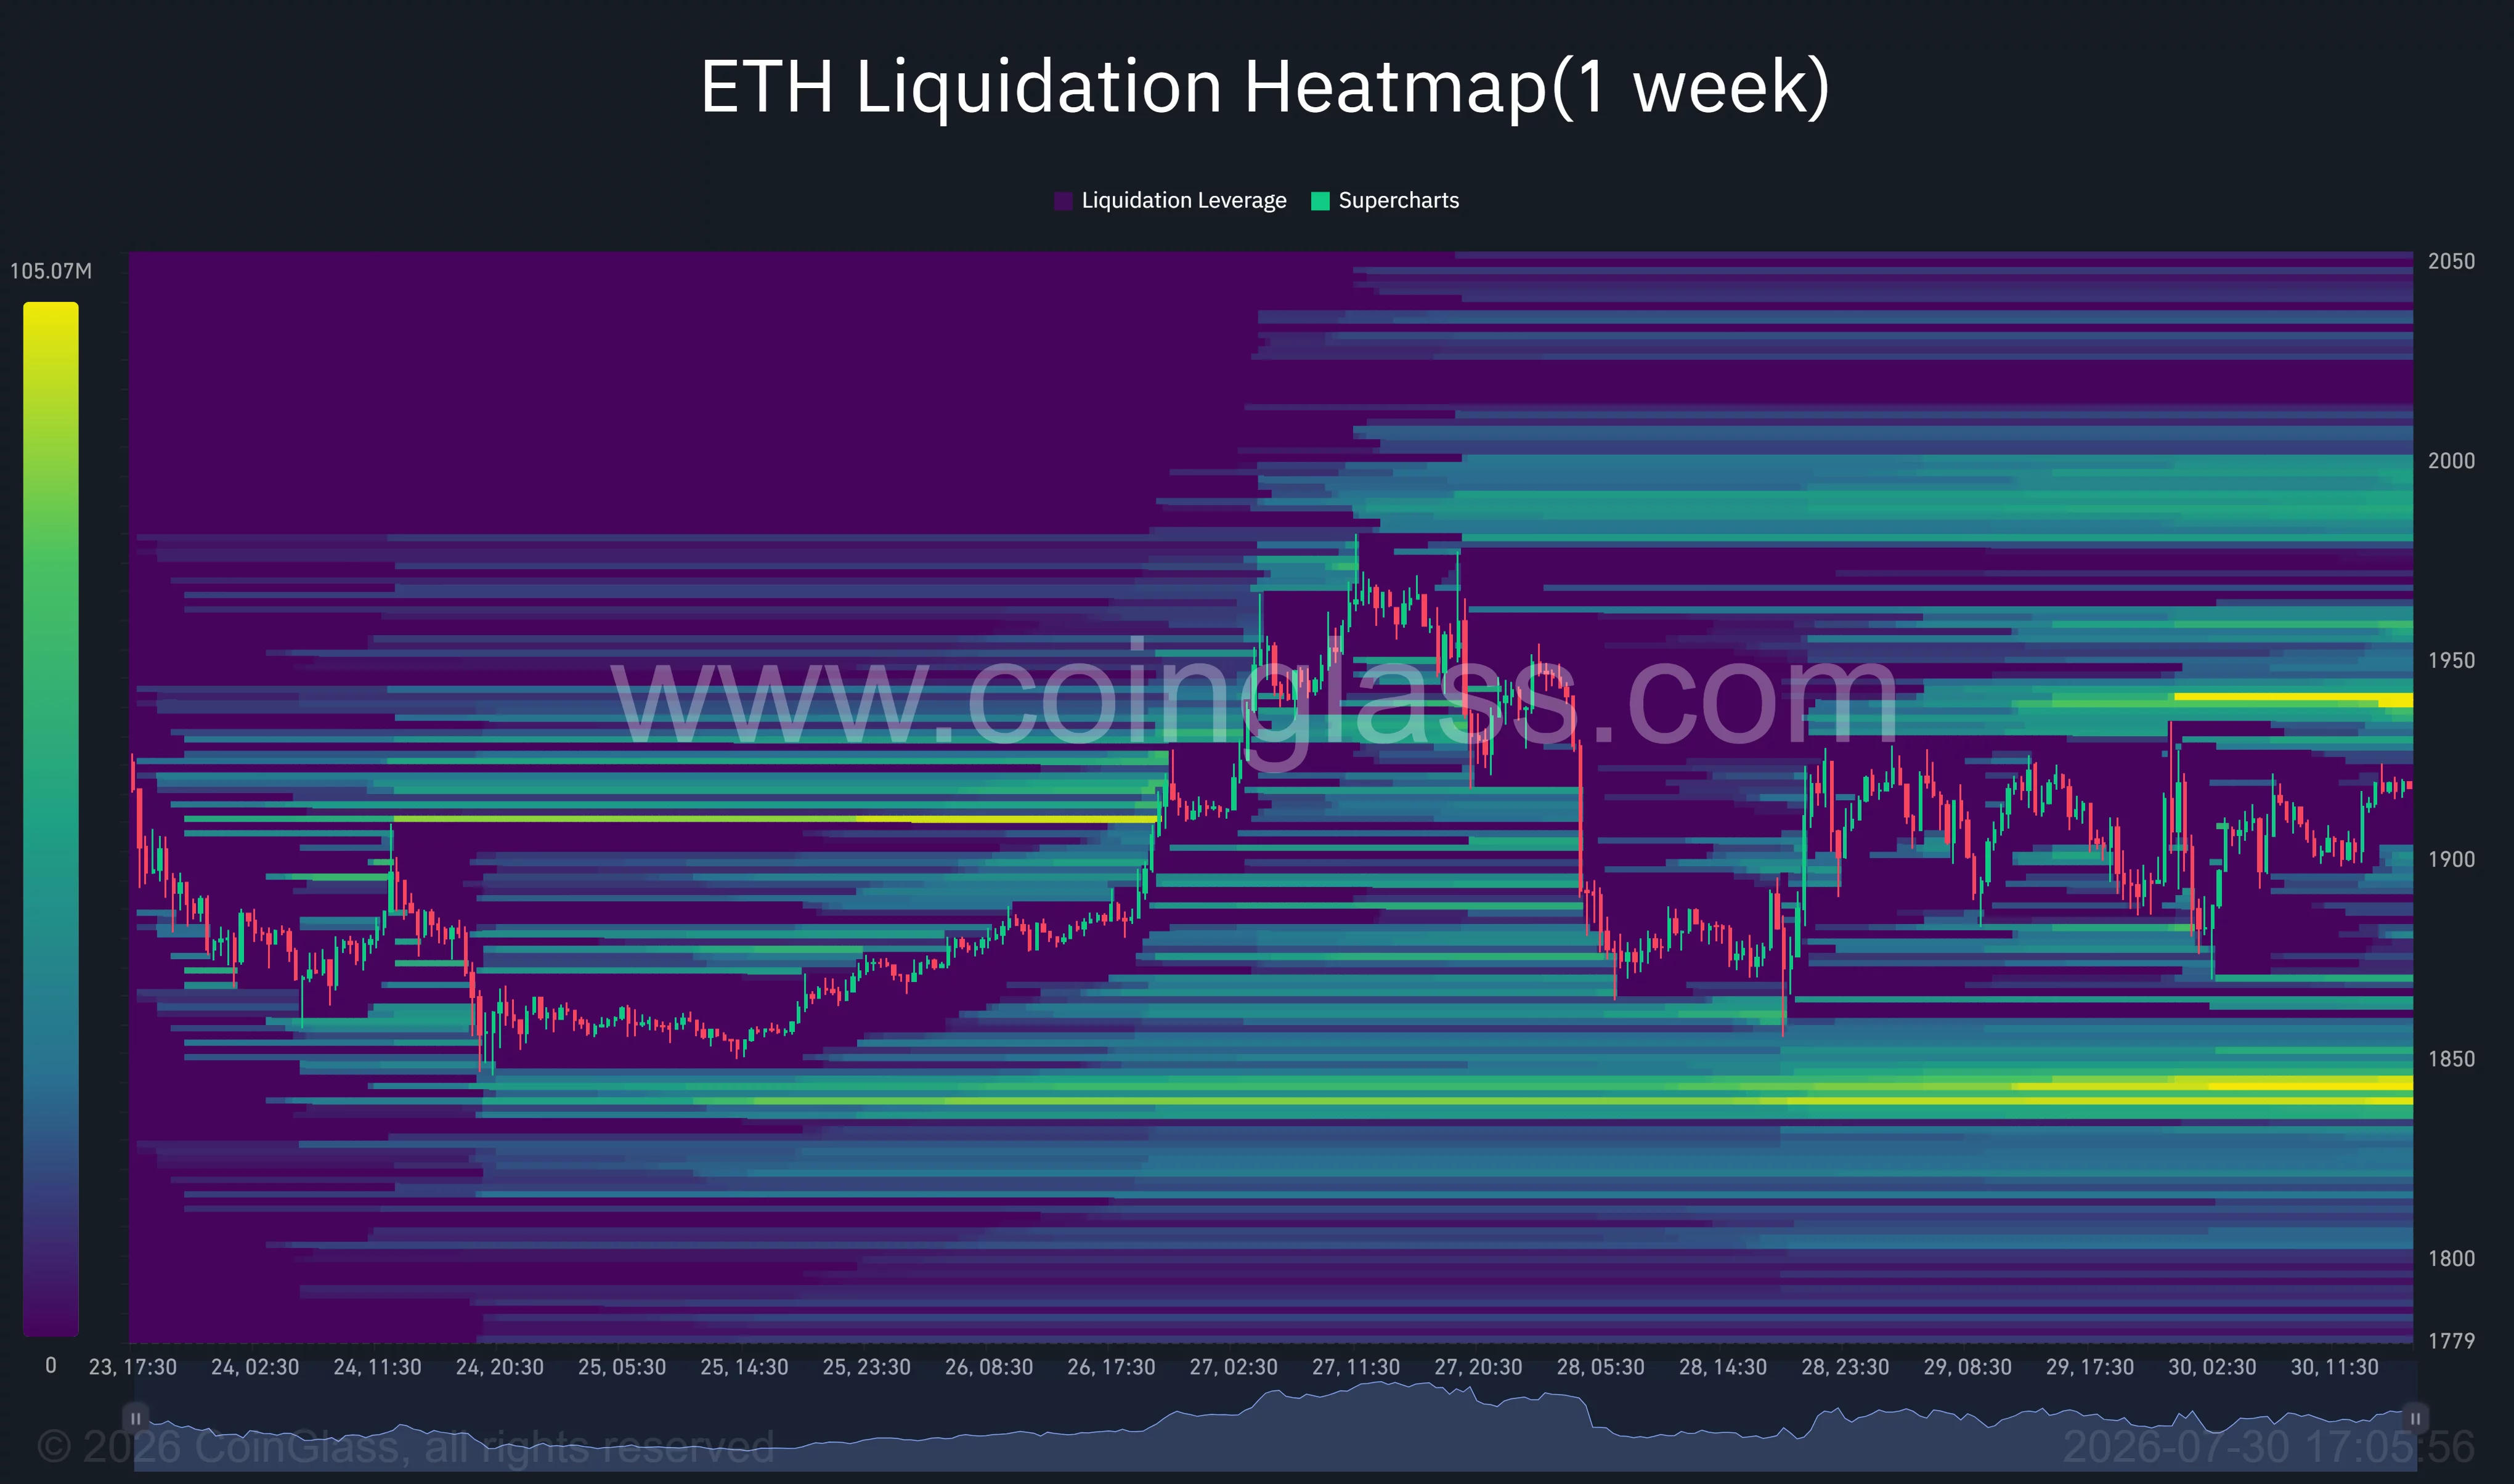
Downside liquidity is concentrated near $1,840. If Ethereum loses the ascending trendline and breaks below $1,888, that lower cluster could attract price and expose the 200-period average near $1,800.
Analysts see upside if support holds
Crypto analyst Michaël van de Poppe expects the recovery to continue while Ethereum remains above its medium-term moving averages.
“As long as ETH remains above the 21-Day MA and the 50-Day MA, higher prices are likely going to follow.”
Van de Poppe also identified US personal consumption expenditure inflation and advance gross domestic product data as the next macro catalysts. Softer inflation could ease pressure on Treasury yields and improve demand for technology stocks and cryptocurrencies.
Analyst Ted Pillows placed Ethereum’s main support slightly lower.
“As long as the $1,850–$1,870 level holds, the next big move for Ethereum will be upside.”
For now, Ethereum’s structure remains resistant to the negative backdrop rather than decisively bullish. Holding above $1,888–$1,900 preserves the recovery, but a sustained breakout will likely require ETH to clear $1,940 with stronger volume before overcoming the larger $1,980–$2,000 supply zone.
Disclosure: This article does not represent investment advice. The content and materials featured on this page are for educational purposes only.
