




Bitcoin returned above $65,000 on Tuesday as a rebound in Asian technology stocks restored some risk appetite after last week’s semiconductor selloff.
Summary
- Bitcoin reclaimed $65,000 as Asian chip stocks rebounded and broader risk appetite strengthened across markets.
- U.S. spot Bitcoin ETFs extended inflows to five sessions, adding fresh institutional support for prices.
- MACD and RSI readings improved, while $70,000 remains BTC’s next major technical resistance level ahead.
At the time of writing, crypto.news price data showed BTC trading around $65,245, up 1.23% over 24 hours and 5.02% over seven days. Trading volume stood near $32.18 billion.
The broader crypto market also moved higher. Crypto.news showed Ethereum near $1,901, XRP around $1.11, Solana at $77.73, BNB near $571 and Hyperliquid around $62.49. Dogecoin traded near $0.073. The gains followed a sharp reversal across Asian equity markets, where South Korea’s Kospi rose 4.7%, Japan’s Nikkei gained 2.8% and Taiwan’s Taiex climbed 3.6%.
Bitcoin recovers as Asian chip stocks reverse losses
The Bitcoin rebound followed the same part of the market that drove last week’s decline. Semiconductor and artificial intelligence stocks had sold off sharply as investors questioned high valuations and reacted to new competition from China’s AI sector. Bitcoin fell below $64,000 as the technology selloff spread across global risk assets.
Buyers returned to many of those stocks on Tuesday. Samsung Electronics, SK Hynix and Taiwan Semiconductor recovered alongside broader Asian benchmarks. BTC moved with the improved market mood and briefly reached its highest level in roughly two weeks. The move continued a recovery from the June low area near $58,000 to $60,000.
Oil also offered some support to risk markets. Brent crude fell about 1% toward $88 after reports that mediators had proposed a 10-day ceasefire between the U.S. and Iran. Fighting remains active and no agreement has been confirmed, but the pullback in oil eased some pressure from the previous two sessions.
Five-day ETF inflow streak supports recovery
U.S.-listed spot Bitcoin ETFs have also turned positive after a difficult stretch of withdrawals. According to SoSoValue data, the funds attracted $226.9 million on Monday, extending net inflows to five consecutive sessions and bringing the total across the streak to about $727.3 million.
The return of ETF demand follows heavy selling earlier in the summer. More than $4 billion left U.S. spot Bitcoin ETFs during June, while a 13-session outflow streak between May and early June removed roughly $4.37 billion. The recent shift therefore marks a clear change from the sustained redemptions that weighed on the market.
Institutional flows have not been the only source of accumulation. Large Bitcoin wallets accumulated about 270,000 BTC worth roughly $16.7 billion during a period when ETFs were recording heavy withdrawals. That divergence placed more attention on whether renewed ETF buying could add another source of demand during the recovery.
Bitcoin indicators improve as $70,000 becomes next test
Bitcoin’s daily chart shows stronger short-term momentum after the recovery from its June lows. The chart data supplied with the market update places the MACD line near 464.37, above the signal line at about 93.55, while the histogram remains positive around 370.82. That structure shows that buying momentum has strengthened from the previous downside phase.
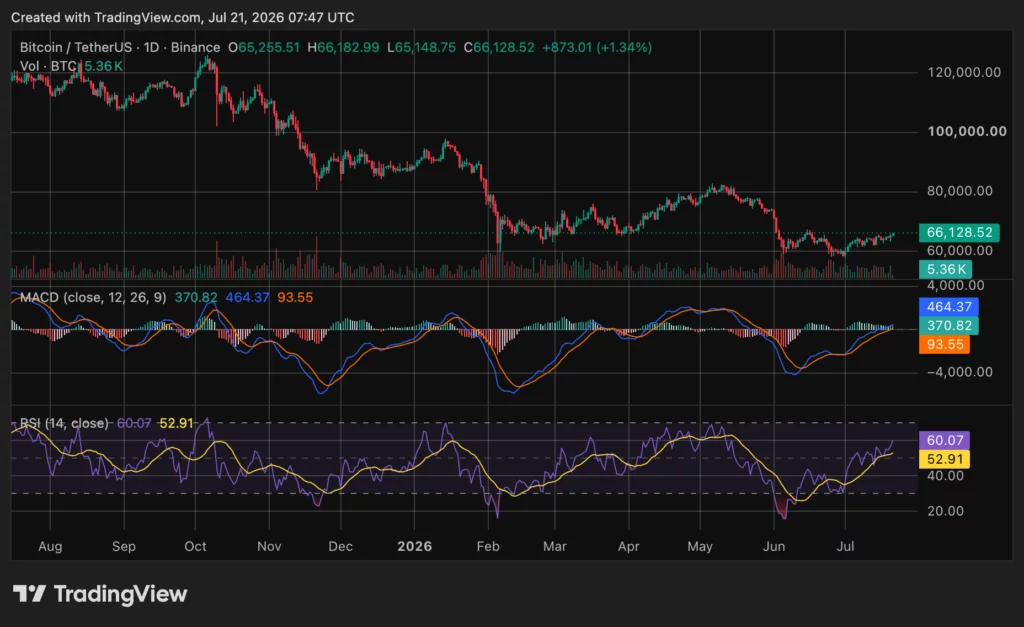
The RSI also supports the short-term recovery. It stands near 60.07, above its moving average around 52.91 and above the neutral 50 mark. However, the indicator remains below traditional overbought levels. Holding above $65,000 would keep the current recovery structure intact, while the $70,000 area represents the next closely watched test for buyers.
Onchain data offers another view of BTC’s position within its broader market cycle. According to crypto market intelligence platform Alphractal, its four-year standardized MVRV model identifies readings below a Z-score of -1 as periods of severe historical undervaluation and potentially stronger windows for dollar-cost averaging. The firm argues that MVRV can help investors measure where Bitcoin’s market value sits relative to the prices at which coins last moved onchain.
That metric does not provide a short-term price forecast, and historical patterns do not guarantee future returns. However, it adds another data point as BTC attempts to rebuild momentum after falling sharply from its 2025 record above $126,000. Crypto.news currently places BTC about 48% below that peak.
Disclosure: This article does not represent investment advice. The content and materials featured on this page are for educational purposes only.
