


Solana price remains under corrective pressure as fading bullish volume and unresolved liquidity below price open the door for a move toward the $57 Fibonacci extension.
Summary
- $170 support flipped to resistance, confirming bearish market structure
- Low-volume bounces signal weak demand, increasing downside risk
- $57 Fibonacci extension is critical, acting as a potential capitulation and reversal zone
Solana (SOL) price action continues to trade within a broader corrective phase after losing key structural support earlier in the cycle. While short-term bounces have emerged, the lack of strong bullish participation suggests these moves may be temporary rather than trend-defining.
As Solana struggles to reclaim former support that has now become resistance, technical conditions are aligning for a deeper downside move before any meaningful reversal can occur.
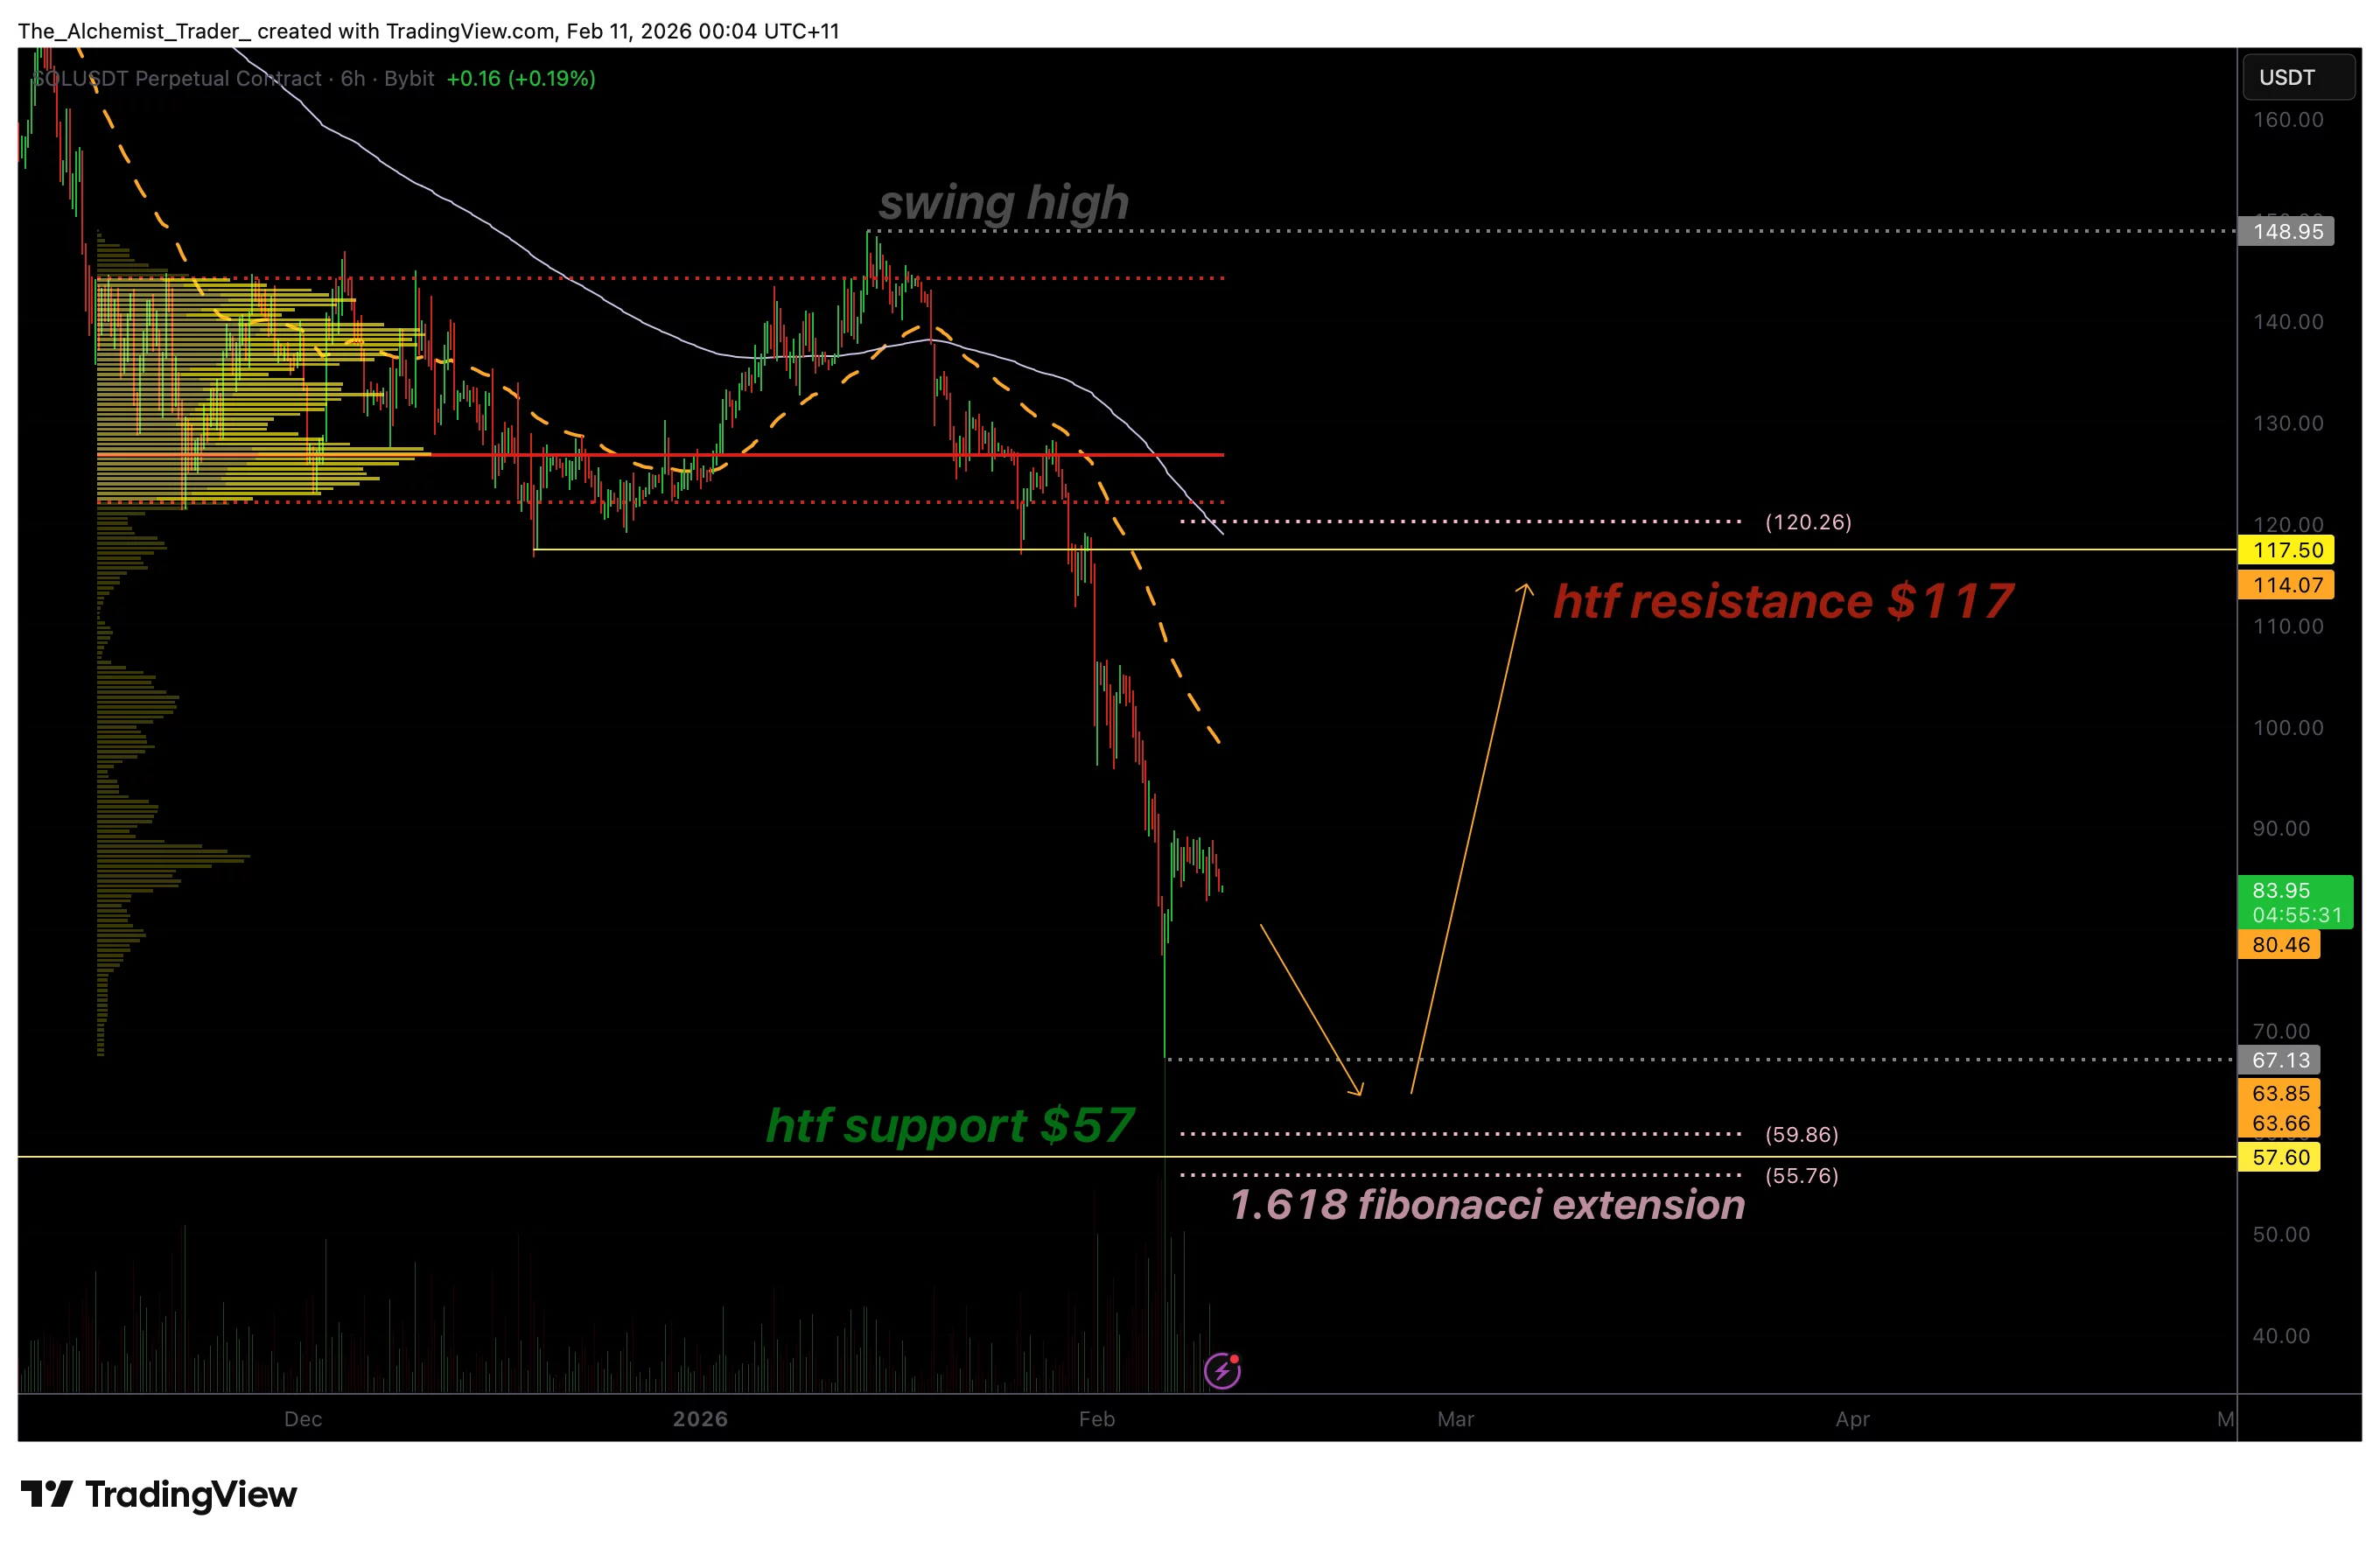
With volume declining and liquidity building below current price levels, attention is now shifting toward a key high-timeframe Fibonacci extension zone near $57, a level that may act as a pivotal inflection point for Solana’s next major move.
Solana price key technical points
- Former support at $170 has flipped into resistance, confirming bearish structure
- Bullish bounces are occurring on low volume, signaling weak demand
- $57 Fibonacci extension stands out as a macro reversal zone, with strong confluence
The current corrective move accelerated after Solana decisively broke below the $170 level, which had previously acted as a major area of support. Once this level was lost, price quickly transitioned into resistance, reinforcing the bearish shift in market structure. Multiple attempts to reclaim this zone have failed, confirming that sellers remain in control.
Following the breakdown, Solana experienced a sharp downside expansion into the high-timeframe support region near $157. This move reflected capitulation-style selling, though price has so far failed to officially retest the exact support level, instead printing a higher low just above it. While this may appear constructive at first glance, the broader context suggests unfinished business remains below the current price.
Low-volume bounce raises downside risk
One of the most notable aspects of Solana’s recent price behavior is the lack of bullish volume accompanying the bounce from the $157 region. In healthy reversals, price rebounds are typically supported by expanding volume, signaling strong buyer conviction. In this case, however, volume has remained subdued, indicating that the bounce may be driven more by short covering than genuine accumulation.
This type of low-volume recovery often leaves price vulnerable to further downside, particularly when liquidity remains concentrated below recent lows. As a result, the probability increases that Solana may revisit the lower support zone to fully clear remaining sell-side liquidity.
$57 fibonacci extension comes into focus
From a Fibonacci and market structure perspective, the 0.618 extension near $57 represents a critical macro level. This zone aligns with multiple technical factors, including historical demand areas and structural liquidity pockets, making it a high-probability target if the current corrective phase continues.
Such extension levels often act as magnets for price during strong corrective moves, particularly when broader sentiment remains cautious and volume fails to confirm reversals. A move toward $57 would likely coincide with heightened volatility and emotional selling, conditions that frequently precede meaningful market bottoms.
Importantly, a test of this level would not necessarily signal further breakdown. Instead, it may represent the final leg of the corrective structure, setting the stage for a potential macro reversal if buyers step in decisively.
Conditions for a bullish reversal
If Solana does trade into the $57 Fibonacci extension zone, the quality of the reaction will be crucial. A strong defense of the high timeframe support, combined with expanding volume and clear bullish rejection signals, would increase the probability of a sustainable reversal.
Should such a reversal occur, Solana could begin a rotational move back toward higher resistance levels, with the $170 region once again coming into focus. This would effectively keep the broader trading range intact, transforming the recent decline into a completed corrective cycle rather than the start of a prolonged downtrend.
What to expect in the coming price action
From a technical, price action, and market structure perspective, Solana remains vulnerable to further downside as long as bullish volume continues to fade. The $57 Fibonacci extension is the most important downside target and potential reversal zone.
Until that area is tested or convincingly invalidated, traders should remain cautious of short-term rallies. Volatility is likely to remain elevated, with price action driven by liquidity dynamics rather than sustained trend shifts. How Solana reacts near $57 may ultimately determine whether the market is preparing for a deeper correction or laying the groundwork for its next major bullish phase.