Close Menu

    Subscribe to Updates

    What's Hot

    Pepe croaks as whale exodus deepens and buyers flinch

    June 7, 2025

    Beijing taps Hong Kong to liquidate seized crypto

    June 7, 2025

    Lagrange rockets, then reenters reality as hype fizzles

    June 7, 2025
    Facebook X (Twitter) Instagram
    laicryptolaicrypto
    Demo
    • Ethereum
    • Crypto
    • Altcoins
    • Blockchain
    • Bitcoin
    • Lithosphere News Releases
    laicryptolaicrypto
    Home XRP price bearish pattern points to a 50% crash
    Crypto

    XRP price bearish pattern points to a 50% crash

    John SmithBy John SmithJune 6, 2025No Comments2 Mins Read
    Share
    Facebook Twitter LinkedIn Pinterest Email


    XRP price has been under pressure this year, dropping by over 37% from its highest point in November. 

    Ripple (XRP) was trading at $2.15 on Friday, a notable price as it matches the level seen on January 1. The coin has formed a distinct bearish pattern, signaling a potential 75% crash to $0.52.

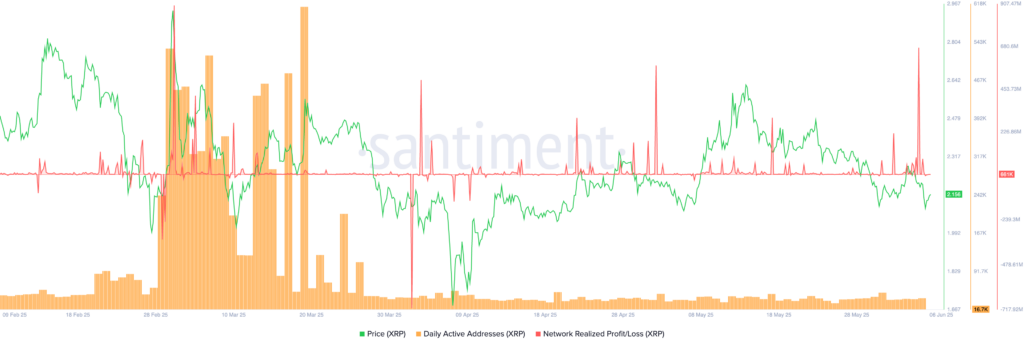
    On-chain metrics suggest that the network is struggling. Active addresses have plunged from 612,000 in March to just 16,000 today. Similarly, there are signs of whale capitulation. Addresses holding between 10 million and 100 million coins now hold 7.53 billion XRP, down from 7.8 billion last week.
    Red alert: XRP price bearish pattern points to a 50% crash - 1
    XRP on-chain data | Source: Santiment

    Additionally, the recently launched Teucrium 2x Long Daily XRP ETF appears to be losing momentum. Its assets under management have declined from $110 million in May to $102 million.

    XRP price technical analysis points to a crash
    xrp price
    XRP price chart | Source: crypto.news

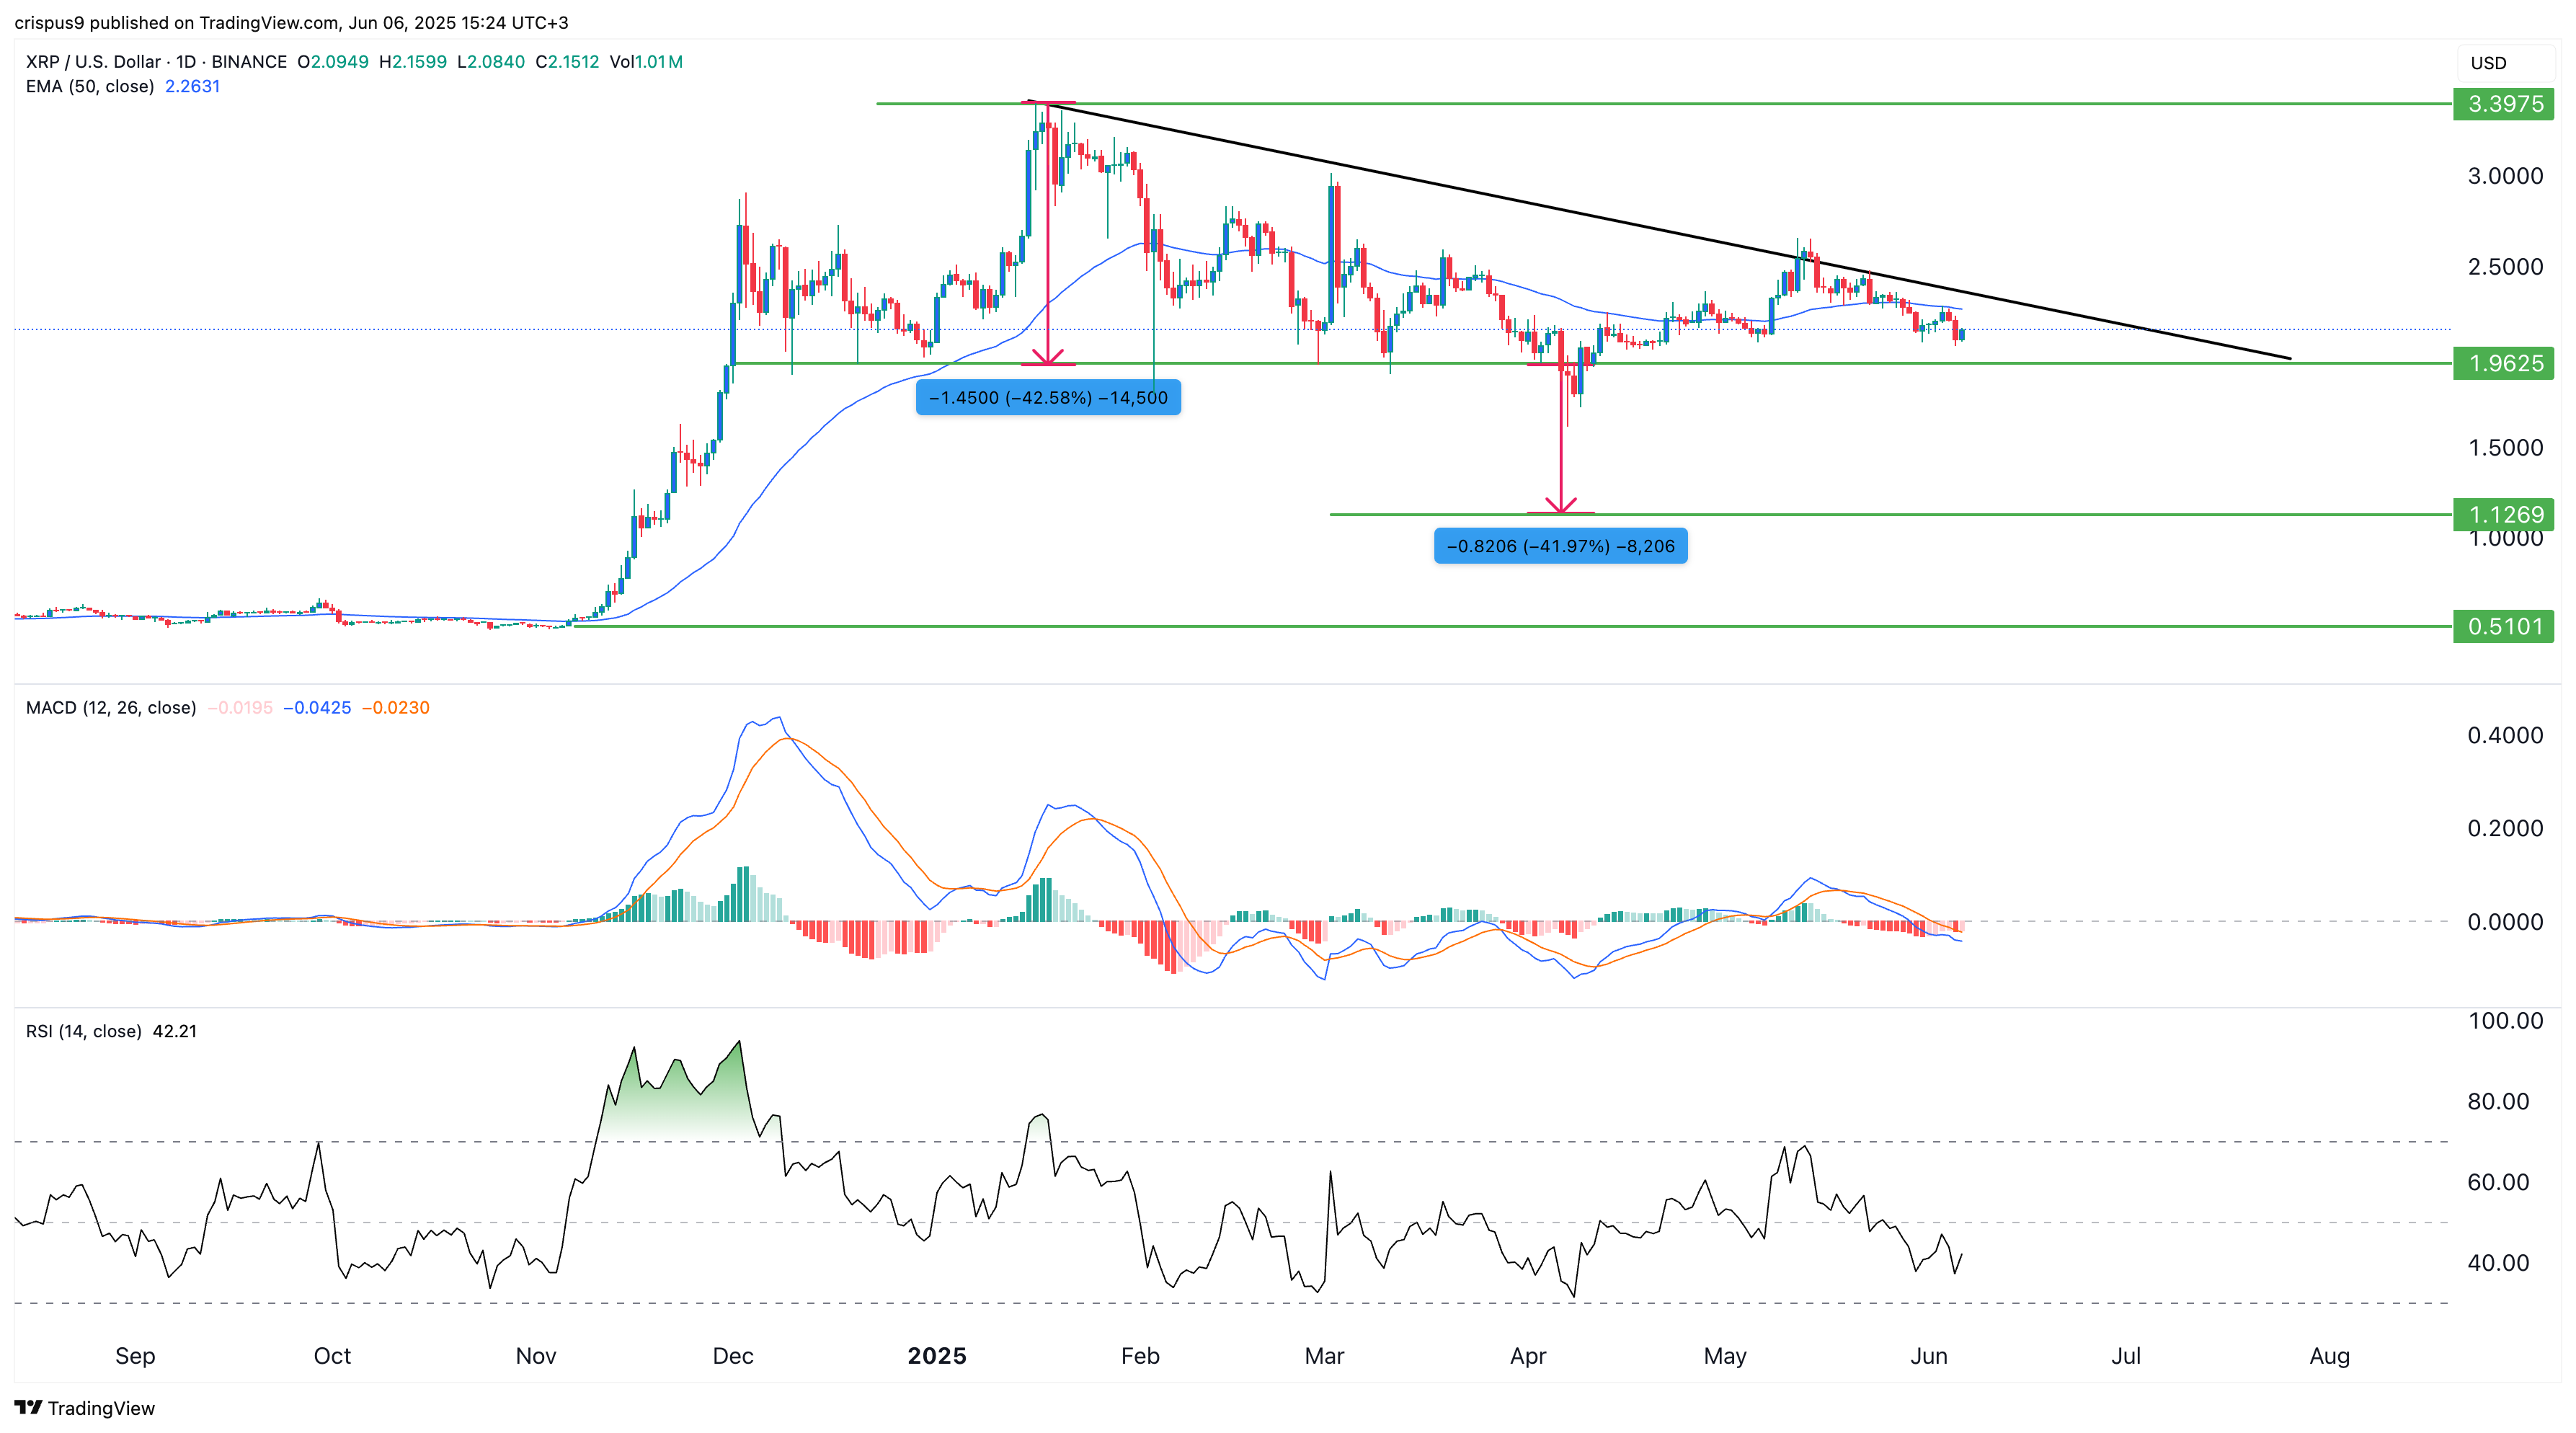
    The daily chart shows that XRP peaked at $3.40 in November following Donald Trump’s election.

    It has since dropped 37% to the current $2.15 despite a series of positive developments, including the end of the SEC vs Ripple case, Hidden Road acquisition, and ETF applications.

    The coin has fallen below the 50-day Exponential Moving Average, signaling that bears currently have control.

    XRP has also formed a descending triangle pattern, defined by a horizontal support level and a descending trendline. The lower boundary of this pattern is at $1.9625, a level that has held firm on multiple occasions since November. The descending trendline connects the swing highs from January 16, March 1, and March 13.

    Descending triangles typically precede bearish breakouts. The projected price target, based on the pattern’s height, is a 42% decline from the $1.9625 support, pointing to a possible drop to $1.1270.


    Source link

    Share. Facebook Twitter Pinterest LinkedIn WhatsApp Reddit Tumblr Email
    John Smith

    Related Posts

    Pepe croaks as whale exodus deepens and buyers flinch

    June 7, 2025

    Beijing taps Hong Kong to liquidate seized crypto

    June 7, 2025

    Lagrange rockets, then reenters reality as hype fizzles

    June 7, 2025
    Leave A Reply Cancel Reply

    Demo
    Don't Miss
    Crypto

    Pepe croaks as whale exodus deepens and buyers flinch

    By John SmithJune 7, 20250

    Pepe coin price retreated this week as whales continued selling and the crypto market sell-off…

    Beijing taps Hong Kong to liquidate seized crypto

    June 7, 2025

    Lagrange rockets, then reenters reality as hype fizzles

    June 7, 2025

    Unilabs Finance’s DeFi manager gains traction as top TradFi alternative, beating TRON, Solana

    June 7, 2025

    LAI Crypto is a user-friendly platform that empowers individuals to navigate the world of cryptocurrency trading and investment with ease and confidence.

    Our Posts
    • Altcoins (561)
    • Bitcoin (27)
    • Blockchain (134)
    • Crypto (8,310)
    • Ethereum (619)
    • Lithosphere News Releases (138)

    Subscribe to Updates

    • Twitter
    • Instagram
    • YouTube
    • LinkedIn

    Type above and press Enter to search. Press Esc to cancel.